


INTRODUCTION
Fat embolism after autologous fat injection into face is an uncommon but serious complication1). It typically develops within 12 hours to 3 days after the injection procedure. Clinical features are respiratory distress, neurologic symptoms and cutaneous signs2). The neurologic symptoms ranging from focal neurologic deficits to coma or even death may vary considerably2,3). The cerebral involvement in the case of fat embolism has been termed cerebral fat embolism (CFE). Brain magnetic resonance image (MRI) and magnetic resonance spectroscopy (MRS) are considered to be a useful diagnostic tool for CFE4-7). In this report, we describe MRI and MRS findings in a patient with CFE after autologous fat injection.
CASE REPORT
A previously healthy 26-year-old female was hospitalized for a sudden attack of right visual loss and left hemiplesia which was developed 13 hours after an autologous fat injection into her face under local anesthesia. On initial examination in emergency department, she was alert with a blood pressure of 120/80 mm Hg, a regular heart beat of 72 beats/min, and a temperature of 36.2в„ғ. Physical examinations did not demonstrate any other abnormal findings. On neurologic examination, however, she had a gaze palsy of the right eye, especially medial and upward gaze limitation. The pupil was dilated and unresponsive to direct light stimulation. Left side motor responses were decreased as compared with right side (upper-grade I and lower-grade II). An emergency non-contrast brain computed tomography (CT) was examined within 3 hours after the first symptom onset and showed large low attenuated lesion in right parietal lobe.
Shortly after CT examination, the first diffusion-weighted imaging (DWI) was obtained, because she had complained with newly developed symptoms such as right side facial palsy, the second following MRI examination was performed after 30 hours from the original symptom onset. In addition to T1-weighted, T2-weighted, and fluid attenuated inversion recovery, the second DWI, and time-of-flight MR angiography scans, MRS data were obtained with proton single-voxel MR spectroscopy (SVS) studies with a point-resolved spectroscopy (PRESS). Four regions-of-interest (ROIs) were defined at two high signal intensity lesions on DWI (Fig. 2B, D) and two contralateral normal brain parenchyma (Fig. 2A, C). We positioned two paired ROIs because we wanted to find out MRS findings of infarcted lesions in the two different time interval and compare the MRS metabolic alternations between normal brain parenchyma and infarcted lesions.
The PRESS SVS was acquired with water suppression accomplished with the chemical shift selective sequence pulses with a bandwidth of 160 Hz, applied on-resonance with the water signal. Two different TEs, TE=40 msec and 144 msec, were used to identify the signal from lactate. Scan conditions were : TR=2000 ms, 128 averages, spectral bandwidth=2000 Hz, and 1024 sampling points. The scan time was 4.5 minutes for each TE and each ROI. The spectral data were obtained from voxel sizes of 3.375 cc (15Г—15Г—15 mm).
The SVS data were analyzed using SpectroView software in the MRI system (Achieva 3.0T, Philips Healthcare, the Netherlands) with zero-order phase correction based on the water peak, Gaussian line broadening filter of 3 Hz, zero-filling by a factor of 8, and high-pass convolution filter to remove the residual water signal in the time domain. The processed spectra have a range from 4.3 to 0.1 ppm. Area quantification of Choline (Cho) peak at 3.2 ppm and N-acetyl-aspartate (NAA) peak at 2.01 ppm was assessed relatively to Creatine (Cr) peak at 3.01 ppm on each TE spectrum, as well as the resonance of Lactates at 1.4 ppm that is positive from the baseline at TE=40 ms, but is negative at TE=144 ms.
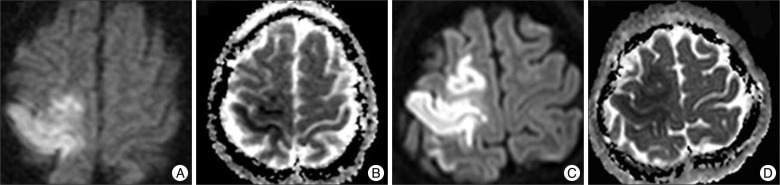
Fig. 1 shows DWIs and the corresponding ADC maps scanned at the first attack (Fig. 1A, B) and at the second attack (Fig. 1C, D). The first DWI scanned at three hours after original symptom onset, revealed the acute focal infarction in the right frontoparietal lobe and small acute infarctions in the right temporal lobe and right caudate head with diminishing ADC values and without showing hemorrhagical areas. The second DWI scanned at thirty hours after the original symptom onset, showed other acute infarctions in the right frontal lobe, parietal lobe, basal ganglia, genu of corpus callosum and subcortical white matters.
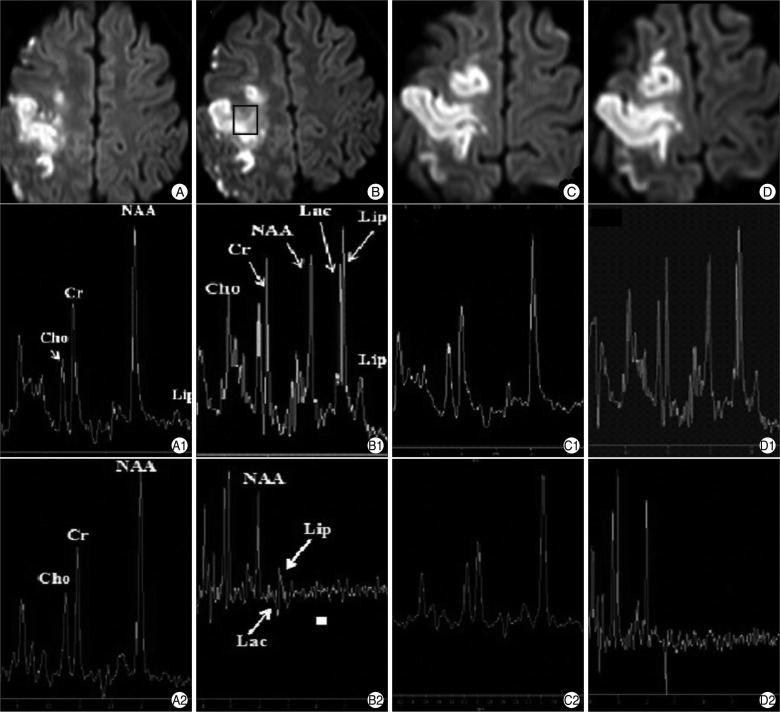
Fig. 2 shows results of PRESS SVS studies with two different TEs. With the short TE=40 ms, four spectra were obtained at the normal areas (Fig. 2A1, C1) and lesions (Fig. 2B1, D1). As compared with normal brain parenchyma, right parietal and frontal lobe lesions revealed three major changes : decrease in NAA and increase in the lactate and lipid signals. Values of NAA/Cr, Cho/Cr, Lipid/Cr, and Lactate/Cr are listed in Table 1.
With the long TE=144 ms, four spectra were obtained at the normal areas (Fig. 2A2, C2) and lesions (Fig. 2B2, D2). As compared with normal brain parenchyma, right side lesions showed a decreased NAA and a slightly increased lipid value, but there was no positive lactate value. Values of NAA/Cr, Cho/Cr, Lipid/Cr, and Lactate/Cr are listed in Table 1. As compared with the result of the short echo time (Fig. 2A1-D1), negative lactate values were noted on long echo time (Fig. 2A2-D2) and the ratio of NAA/Cr on the long TE was slightly reduced except ROI A and the ratio of Cho/Cr was slightly increased.
Low dose of methylprednisolon (9 mg/kg intravenously) were administered, followed by high dose of prednisolone (30 mg/kg intravenously), and then tapering off after one week.
DISCUSSION
Autologous fat injection into the face is becoming common procedure in the plastic surgery, and infection and sepsis are the main immediate complications8). Sudden attack of visual loss or cerebral infarction is rare, but serious complication1). The pathogenesis of CFE after autologous fat injection is associated with prominent vascularization of facial tissue. Fat injection into the face induces a local increase in pressure, the fat particles can reach ophthalmic and internal carotid arteries by reversed flow, with subsequent distal movement of the emboli into the retinal and cerebal arteries3,6).
Previous studies of CFE have obtained data only focusing on MRI5,7) or MRS metabolites3). In this study, we have obtained those MRS findings of CFE with two different echo times and two different time intervals in the regions of abnormal areas and compared lesions with normal brain tissue.
The main MRS findings in this study was the changes of NAA, lactate and free lipids between 0.9 and 1.4 ppm. In acute infarcted lesion, two major changes were observed as compared with normal brain parenchyma : a decrease in NAA, which is normally the most prominent value, and an increase in lactate. In addition, the highly early peak of lipid between 1.0 and 1.5 ppm suggested fat embolism associated with acute infarction. High NAA/Cr ratio suggested possibility of the acute CFE contrary to thrombotic ischemia.
Furthermore, MRS studies with two different TEs can distinguish the lipid (0.9-1.5 ppm) and lactate peaks (1.3 ppm) on proton MRS. Both peaks are usually indistinguishable in a short TE sequence, but can distinguish in a long TE sequence as lipid has a positive peak at 0.9-1.5 ppm and lactate has an inverted doublet peak at 1.3 ppm.
CONCLUSION
In case of autologous fat injection into the face involving altered mental status, visual disturbance or hemiplegia, we should be suspected CFE, although very uncommon. MRS is very helpful to distinguish CFE with other conditions manifesting as disseminated hyperintense lesions and to evaluate the cause materials of infarctions rather than conventional MRI or DWI.