


INTRODUCTION
Injury to the cervical spine in children occurs more frequently in the upper cervical spine. Therefore, anatomical familiarity with the craniovertebral junction (CVJ) can increase the physician's capacity for management of such injuries. It can be difficult to find precise pathology in pediatric spines, due to the unfused nature of the synchondroses, incomplete ossification and the relative hypermobility of the cervical spine4). Until now, morphological investigation of the pediatric CVJ spine has been very limited. Moreover, there is little information available on the normal growth pattern and normal variation of the CVJ region. Typically, the pediatric vertebrae start to mature at about age 8 years; however, spinal growth patterns may vary4).
Our objectives were to retrospectively analyze the morphological changes in the CVJ region and determine age-dependent morphological characteristics of the CVJ region using computed tomographic (CT) scans.
MATERIALS AND METHODS
A total of 247 cervical spine or neck CT scans (M : 151, F : 96) were included in this study. All patients were younger than seven years of age at time of admission during the 8-year study period (April 2006 to October 2013). All patients underwent CT evaluation for other reasons (e.g., minor trauma, otorhinolaryngeal problem). The average age of the patients was 47.8±21.3 months (range, 6-96 months). Patients with a bony or ligamentous injury, deformity, intraosseous pathology, or congenital anomaly were excluded. Nine cases (M : 2, F : 7) were excluded from our study due to lack of an anterior ossified nucleus of C1. Finally, a total of 238 cases were included in this study. All patients underwent standardized bone-window CT scanning from the occiput to the C2 cervical vertebra in a supine neutral position. Linear (in millimeters) and angular measurements were made using m-view 5.4 software (Marosis Technologies, Inc., Seoul, Korea), which enables precise two-dimensional localization of the plane of evaluation. All CT scans were performed on a 64-slice CT scanner with 2-mm axial image thickness (Siemens Medical Solutions, Erlangen, Germany). Sagittal and coronal reconstructions were obtained using 1.25-mm-thick slices. CT films were scanned at a resolution of 512×512 pixels. The thickness or length of the structure was measured with the inter-outer cortical space. Separate sections of axial or parasagittal images were used to determine the most reliable parameters in the whole cervical spine. Reliability was assessed by comparing a subset of measurements of 33 randomly selected cases taken by two different neurosurgeons, using the intraclass correlation coefficient (ICC) test. The ICC ranges from 0 to 1, where 0 represented no agreement and 1 perfect agreement.
The cohorts were divided into three age groups : infancy (I : zero to two years), very early childhood (VE : three to five years), and early childhood (E : older than five years). In addition, a separate assessment was conducted for each individual age group to ensure detailed description of morphological change. The local research ethics committee waived the need for formal ethics approval for this retrospective study.
Occiput morphometric analysis
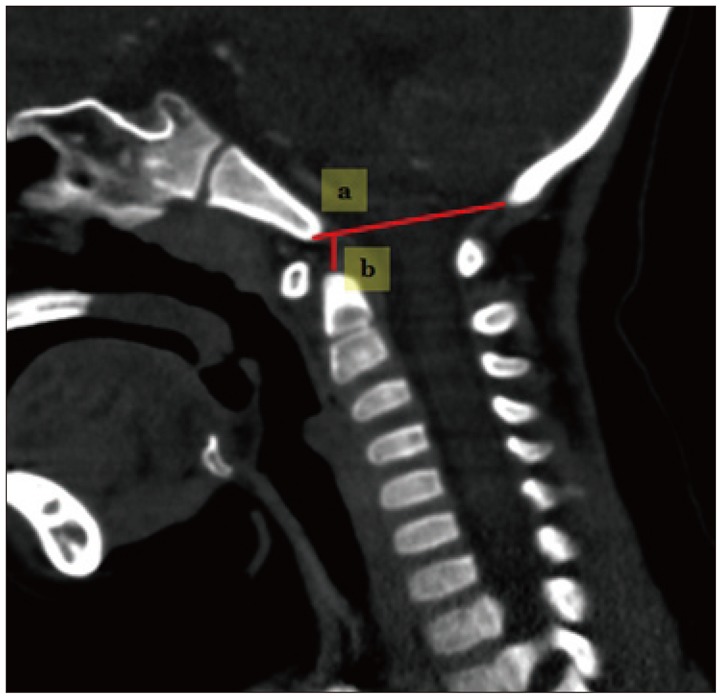
Techniques for measuring the occipital area (Fig. 1).
1) Occiput spinal canal antero-posterior (AP) diameter : a line is drawn across the foramen magnum from the basion (B) to the opisthion (O) in the mid-sagittal plane.
2) McRae line : a perpendicular line is drawn from the odontoid-tip to BO line9).
3) Power's ratio : the distance basion to posterior arch of atlas divided by opisthion to the anterior arch of the atlas12).
C1 (Atlas) morphometric analysis
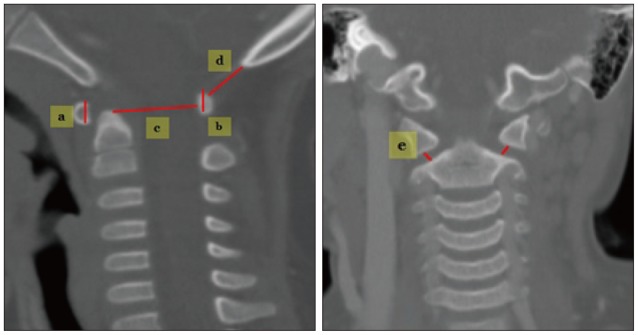
Techniques for measuring C1 (Fig. 2).
1) C1 anterior arch height : measured in mid-sagittal reconstruction images.
2) C2 posterior arch height : measured in mid-sagittal reconstruction images.
3) C1 spinal canal AP diameter (C1-AP) : measured sagittal spinal canal diameter at C1.
4) O-C1 distance : distance between the opisthion and the superior margin of the C1 posterior arch.
5) Atlantoaxial (AA) joint space : bilaterally measured in coronal reconstruction images.
C2 (Axis) morphometric analysis
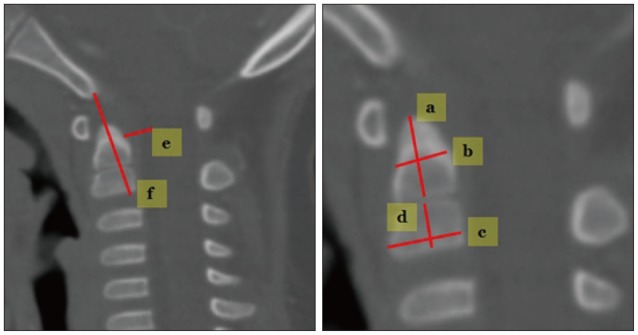
Measuring techniques for C2 (Fig. 3).
1) Odontoid process height : measured in the mid-sagittal plane.
2) Odontoid process AP diameter : from the anterior to the posterior margin of the odontoid process through the middle of the odontoid process.
3) C2 body AP diameter : from the anterior to the posterior margin of the C2 body in the mid-sagittal plane.
4) C2 body height : measured in the center of the C2 body in the mid-sagittal plane.
5) Perpendicular basion-C2 (PB-C2) line : a line is drawn from the basion to the inferoposterior aspect of the C2 body (B-C2 line). The distance represents a perpendicular line from the B-C2 line through the odontoid tip to the ventral dura6). Modified (M)-PB-C2 line excluded the distance in the odontoid bony space, which can show pure ventral epidural space in the spinal canal.
6) Basion to C2 inferoposterior body (B-C2) distance : the shortest distance from the basion to the C2 inferoposterior border of the C2 body.
7) Odontoid process height/C2 body height ratio : distance from the dentocentral synchondrosis to the odontoid tip/distance from the dentocentral synchondrosis to the inferior border of the C2 body.
Statistical analysis
Scheffe's multiple comparison test was used to compare the statistical significance among the I, VE and E age groups. ANOVA test, chi-square tests, unpaired t-tests, paired t-tests, Pearson correlations, and logistic regression tests were performed using SAS (system for windows version 9.3). Statistical significance was set at p<0.05.
RESULTS
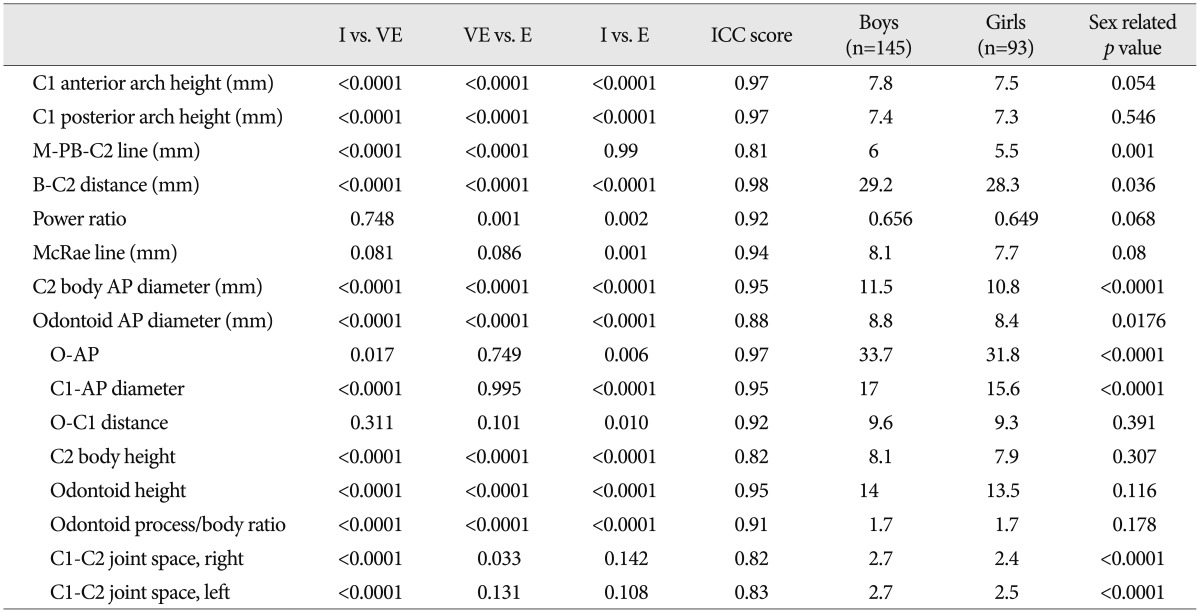
There were 42 cases (17.6%, 22 males and 20 females) included in the I group, 123 cases (51.7%, 81 males and 42 females) in the VE group, and 7 cases (30.7%, 46 males and 27 females) in the E group. The mean ages for the I, VE and E groups were 15±4.9, 43.9±8.8, and 72.6±6.7 months, respectively. ICC score of all measurements (33 cases) was much higher for all parameters (range, 0.82-0.98) (Table 2).
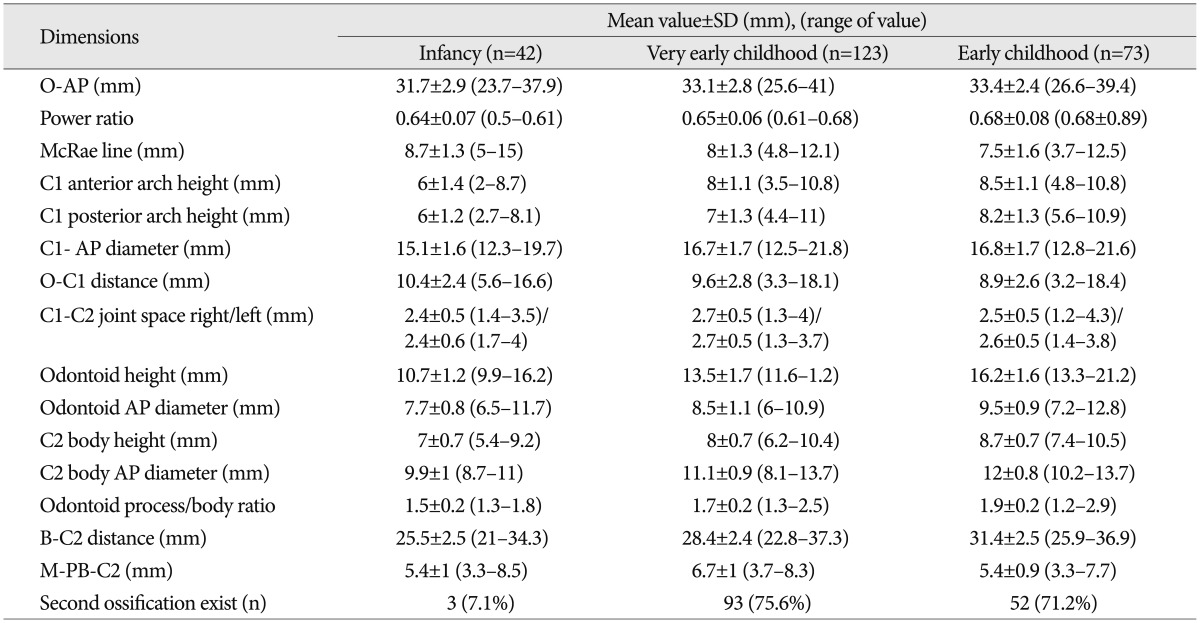
Tables 1 and 2 show the measured mean values according to age group and sex in the cohorts. O-AP increased from 31.7 mm in the I group to 33.4 mm in the VE group with statistical significance (p>0.05); however, the value did not increase with statistical significance after VE age. Mean McRae line was 8.5, 8, and 7.5 mm in the I, VE, and E groups, respectively. Although, the McRae line was relatively constant between adjacent age groups, a statistically significant difference was found only between the I and E groups (p<0.05). The value of Power's ratio remained within normal range (range, 0.5-0.89) throughout youth, but a statistically significant difference was found between the VE and E groups in our results.
The mean values of the C1 anterior/posterior ring height were 6/6, 8/7, and 8.5/8.2 mm in the I, VE, and E groups, respectively. The anterior and posterior C1 ring height exhibited continuous growth with age in all three age groups (p<0.05); however, it did not vary significantly with sex (p>0.05). The C1-AP diameter was only significantly different between the I and VE groups (15.1, 16.8, and 16.7 mm in the I, VE, and E groups, respectively). The means of the O-C1 distance were 10.4, 9.6, and 8.9 mm in the I, VE, and E groups, respectively. The O-C1 distance did not differ significantly with age (p>0.05).
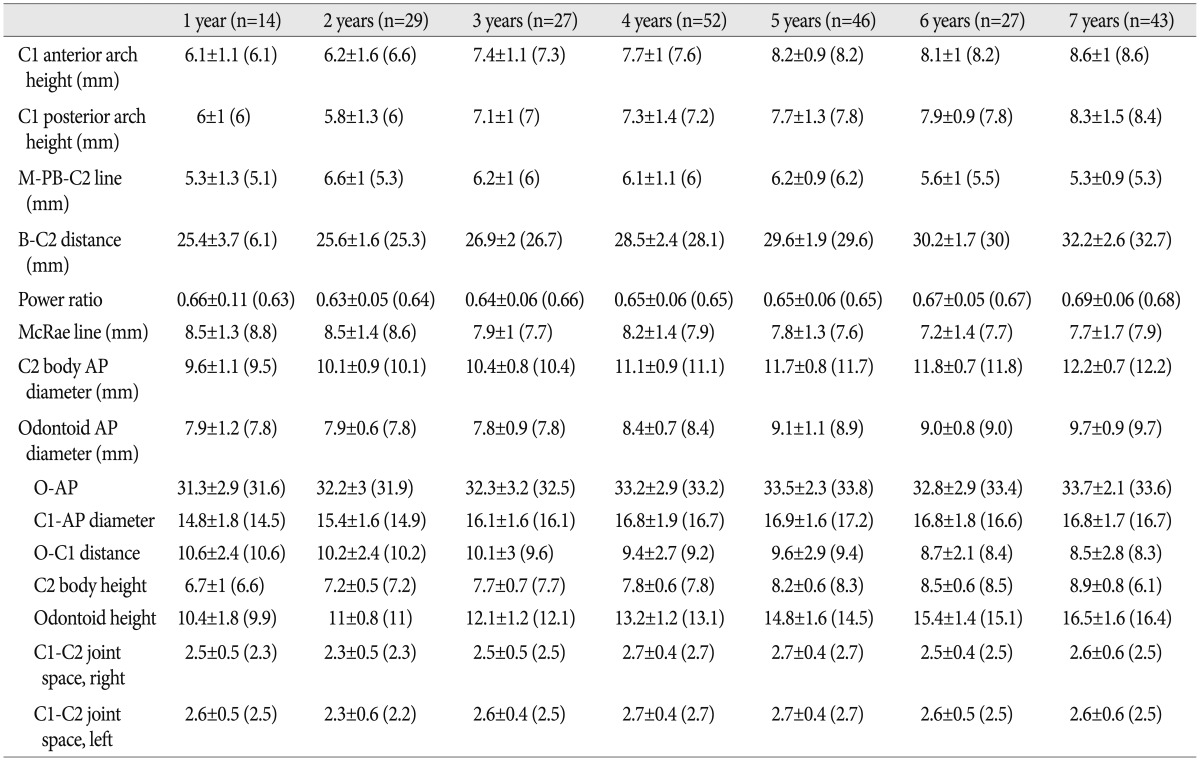
The mean values for the C2 odontoid process and C2 body height were 10.7/7, 13.5/8, and 16.2/8.7 mm in the I, VE, and E groups, respectively. The mean values of the C2 body AP diameter and odontoid AP diameter were 9.9/7.7, 11.2/8.5, and 12/9.5 mm in the I, VE and E groups, respectively. A significant age-related difference was found for all C2 body and odontoid parameters (p<0.05). The odontoid process/body ratio increased with age (1.5-I group, 1.7-VE group, and 1.9-E group). The B-C2 distance increased continuously with age; however, the PB-C2 line showed dynamic change with age (p<0.05). No difference was found in the M-PB-C2 line between the I and E groups (p>0.05). Table 3 highlights the overall mean values for the individual age groups and shows detailed changes in each parameter in our study.
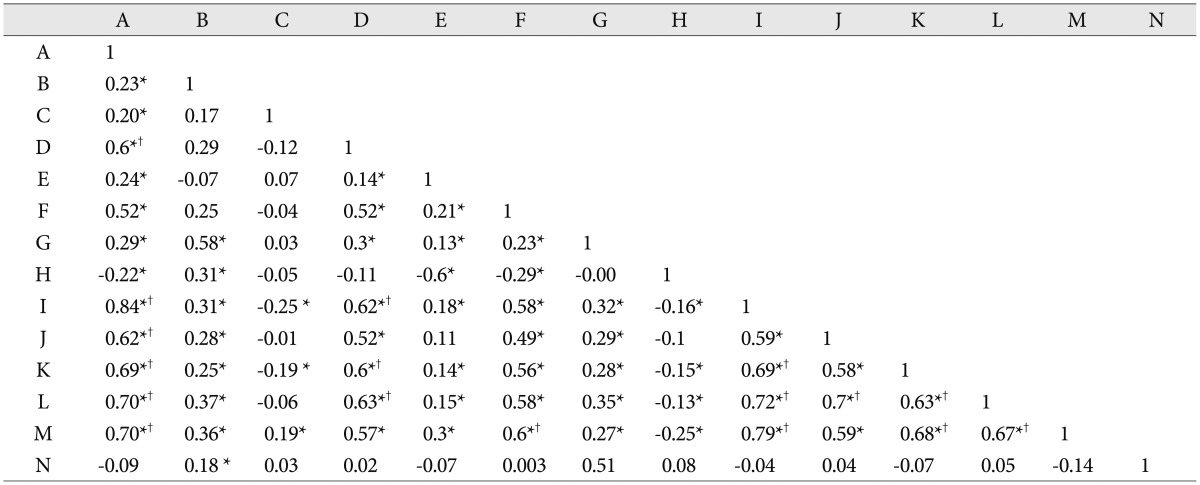
Table 4 presents the Pearson correlation scores between the multiple variables in our study. Moderate or strong correlation scores (r>0.4-moderate correlation, r>0.6-strong correlation) were found between the C1 anterior arch height, C1 posterior arch height, C2 body, C2 odontoid process and age. Generally, C1 arch (anterior and posterior) parameters showed good correlation with C2 body and odontoid process (r=0.515, 0.618) and B-C2 distance (r=0.565). C1-AP diameter exhibited strong correlation with O-AP diameter in our study (r=0.581). B-C2 distance demonstrated a strong relationship with the C2 body and odontoid parameters. Power's ratio showed strong correlation with O-C1 distance (r=-0.6).
DISCUSSION
The CVJ is composed of unique bone structure and a ligament network, which permit dynamic and complex cervical movement and also provide mechanical stability. The establishment of normative values of CVJ morphological development in the young pediatric population would contribute to the understanding of overall spinal growth.
In our study, the O-AP (foramen magnum size) and C1-AP space exhibited relatively limited expansion in young pediatric patients (r=0.581, between C1-AP and O-AP). The mean difference between the I and E groups was only 1.7 mm in the O-AP space, and the growth potency was reduced after the VE age period. After infancy, spinal canal expansion of the C1 level was also restricted, and the mean difference between the I and E groups was only 1.6 mm. Rijken et al.15) reported a similar pattern in their reports, as foramen magnum growth took place within the first 4 years of life. Moreover, Rao et al.14) showed that the C1 spinal canal area was significantly different between the youngest group [cross section area (CSA)-4.34 cm2, younger than three years] and all older groups (CSA-larger than 6.27 cm2, older than three years). Some authors reported that the normal C1-AP is 16-20 mm, and Tokiyoshi et al.18) reported symptomatic stenosis of the C1-AP at 8 mm16). Boys tended to have a larger spinal canal dimensions than girls (O-AP and C1-AP), and this was statistically significant (p<0.0001).
The McRae line decreased with age; however, the decrease was only statistically significant between the I and E groups (p<0.05). Considerable vertical growth of the axis (C2 body height and odontoid height) did not directly decrease the McRae line. Some factors may explain our results. First, C1 lateral mass and occipital condyle vertical growth happen with age, which can counterbalance C2 vertical growth1,8). Second, the AA joint space increased until the VE age period, but then decreased to the initial value after the VE age period. Moreover, the range of the mean value was very narrow among the three age groups (2.4-2.7 mm); thus, the AA joint may be a weak factor affecting the McRae line. Therefore, the C1 lateral mass and other factors can prevent the C2 odontoid process from invaginating into the basal skull lesion with age. The McRae line had a very weak statistical correlation with other factors in our results. Although the value of Power's ratio increased slightly with age, the values of all patients were within normal range (less than 0.9).
The C1 vertebrae have three ossification centers, which form the continuous osseous vertebral ring14,20). Both the C1 anterior and posterior ring height showed the same mean value at infancy. Continuous longitudinal growth occurred in young pediatric periods with statistical significance (p<0.05); however, the pattern of growth varied slightly. Considerably different growth of the C1 anterior ring occurred between the I and VE groups (6 mm-I group, 8 mm-VE group, and 8.5 mm-E group), while posterior C1 arch height growth was relatively even throughout youth (6 mm-I group, 7 mm-VE group, and 8.2 mm-E group). C1 anterior ring growth was closely related to C1 posterior ring growth (r=0.517) and many C2 components (r=0.515-0.630) with statistical significance.
The anatomy and clinical characters of C2 have been well described previously; however, there is little information on the growth pattern of C2 in the pediatric population2,3,5,10,11). C2 grows with four or five separate ossification centers (two neural arches, one body, one odontoid process, and one dens apical center) from the embryological stage through the pediatric stage4,5,20). The vertical growth of C2 predominantly occurs through the odontoid process and its upward projection from the dentocentral synchondrosis (separating odontoid from the body) to the end of the ossification process. The vertical growth of the C2 odontoid process exhibited a more powerful growing potency than the C2 body in young pediatric patients (the mean difference between the I and E groups was 5.7 mm).
Both the AP diameter of the C2 odontoid process and body increased continuously over time with statistical significance (p<0.05). The C2-AP diameter (body and dens) differed between boys and girls with statistical significance; however, vertical lengths did not vary significantly by sex. Previous studies have shown conflicting results with respect to differences between sexes in their adult cohorts7,17).
Although the ratio of the length of the odontoid process to the body showed a pattern of continuous increase in our results, its value may change after pediatric age. Cokluk et al.2) presented data on a decreasing trend of the ratio between pediatric and adult populations (pediatric boys and girls-2.0, adult female-1.7, adult male-1.8).
We used a precise method to evaluate the overall longitudinal growth pattern of the CVJ regions. We supposed that the B-C2 distance reflected all vertical anatomical dimensions of the CVJ regions before the study. Consequently, the B-C2 distance could be used to reflect the C1 and C2 vertical growth pattern, because the dimensions of the C1 anterior arch ring (r=0.565), C1 posterior arch ring (r=0.603), odontoid height (r=0.790) and C2 body height (r=0.680) were very closely related to B-C2 distance. The B-C2 difference between boys and girls was proven with statistical significance (p<0.05). Because the C2 vertical dimension (body and odontoid process) of boys was not larger than that of girls (p=0.307 and p=0.116, respectively), other factors (C1 lateral mass height, occipital condyle) may be the key to explaining the results.
The PB-C2 line may be an alternative diagnostic technique for ventral brainstem compression by the odontoid process and any investing tissues into the foramen magnum or the rostral spinal canal. It was initially adopted to evaluate Chiari malformation Type 1 patients6,19). The M-PB-C2 line showed up-and-down dynamic epidural space change during early pediatric periods. We found some clues to adequately explain the above results. We considered the C1-AP growth pattern and C2 odontoid AP diameter simultaneously. As mentioned above, the C1-AP canal expansion was restricted at a very early age; however, the C2 odontoid process AP diameter continuously increased throughout youth. As a result, the M-PB-C2 distance peaked in the VE group and gradually regressed to the initial state. In fact, M-PB-C2 distance peaked at two years of age (6.6±1 mm), and these values did not vary significantly between the one-year-old (5.3±1.3 mm) and seven-year old (5.3±0.9 mm) groups (Table 3).
Changes in the AA joint were not consistent among the three age groups, and left-right asymmetry was not confirmed statistically in the present study. Regarding the above results, we supposed technical errors in determining the precise localization of the AA joint space were the main factors. Radcliff et al.13) showed larger variability of AA joint space with some anatomic characteristics. First, the concave anatomy of the AA joint can make precise localization difficult. Second, head position can influence the resting AA joint position.
The O-C1 interval tended to decrease with age; however, a statistically significant result was only obtained for the I and E groups (10.4 mm-I group, 9.6 mm-VE group, and 8.9 mm-E group). The decrement of the O-C1 interval can reduce Power's ratio by reducing the OA distance (r=-0.6). We expected that the O-C1 interval would gradually decrease with age, considering other normal adult data (7.33±2.83 mm)13).
CONCLUSION
In conclusion, spinal canal diameter increase was restricted to the very early childhood period (less than 5 years) in the CVJ region, while the C2 body and odontoid process increased continuously with age. Although C2 longitudinal growth proceeded with age (B-C2 distance), the McRae line showed relatively little change.
Limitation and interpretation
This study was designed with a cross-sectional cohort approach rather than a longitudinal approach, and therefore actual time-related development for any one individual could not be determined. Moreover, CT-based measurement can lead to systematic measurement errors, which could cause under- or over-estimation, as observed in previous reports7).