Reliability of Stereotactic Coordinates of 1.5-Tesla and 3-Tesla MRI in Radiosurgery and Functional Neurosurgery
Article information
Abstract
Objective
The aims of this study are to identify interpersonal differences in defining coordinates and to figure out the degree of distortion of the MRI and compare the accuracy between CT, 1.5-tesla (T) and 3.0T MRI.
Methods
We compared coordinates in the CT images defined by 2 neurosurgeons. We also calculated the errors of 1.5T MRI and those of 3.0T. We compared the errors of the 1.5T with those of the 3.0T. In addition, we compared the errors in each sequence and in each axis.
Results
The mean difference in the CT images between the two neurosurgeons was 0.48±0.22 mm. The mean errors of the 1.5T were 1.55±0.48 mm (T1), 0.75±0.38 (T2), and 1.07±0.57 (FLAIR) and those of the 3.0T were 2.35±0.53 (T1), 2.18±0.76 (T2), and 2.16±0.77 (FLAIR). The smallest mean errors out of all the axes were in the x axis : 0.28-0.34 (1.5T) and 0.31-0.52 (3.0T). The smallest errors out of all the MRI sequences were in the T2 : 0.29-0.58 (1.5T) and 0.31-1.85 (3.0T).
Conclusion
There was no interpersonal difference in running the Gamma Plan® to define coordinates. The errors of the 3.0T were greater than those of the 1.5T, and these errors were not of an acceptable level. The x coordinate error was the smallest and the z coordinate error was the greatest regardless of the MRI sequence. The T2 sequence was the most accurate sequence.
INTRODUCTION
With advances in magnetic resonance imaging (MRI) technology, we can depict the brain's normal anatomy and lesions of the brain thanks to the improved resolution and clarity12). Remarkable advances in stereotactic radiosurgery and functional neurosurgery have been made along with improvements in high-tech imaging modalities. However, distortion of the image has become another issue that needs to be overcome when performing surgical interventions, especially in the aspect of precision. This problem was not seen with X-ray films of ventriculography and computerized tomography (CT) in the earlier era. Until now, the errors in the 1.5-tesla (T) MRI were acceptable in radiosurgery and functional neurosurgery, whereas the errors in the 3.0T MRI have not been accepted in general. Besides, interpersonal differences in the practice of radiosurgery have been ignored. Therefore, we measured the errors in the 1.5T and 3.0T MRIs and evaluated the feasibility of the 3.0T MRI. In addition we compared interpersonal differences in defining coordinates using the Gamma Plan® workstation and also compared the errors according to the x, y, z coordinates and according to the MRI sequences.
MATERIALS AND METHODS
Phantom and neuroimage evaluation
A cylindrical MRI phantom (Elekta, Stockholm, Sweden) was used for this study and is shown in Fig. 1. It was made of acrylic plastic and was 180.5 mm in diameter and 131 mm in height. In this volume, there were 190 marker points which were 2 mm in diameter and 2.5 mm in height respectively. We filled the volume with cooking oil to minimize dielectric resonance and chemical shift effects4,7). The markers were clearly visible on the CT and MRI. During the scans, the axes of the phantom were aligned accurately.
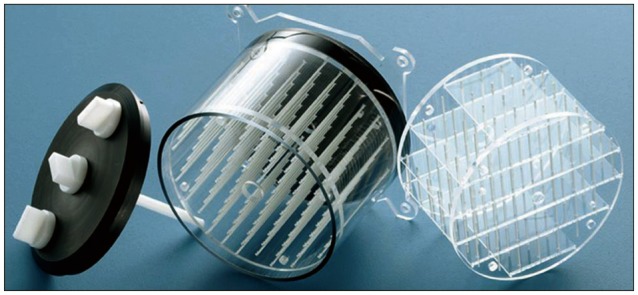
The Elekta magnetic resonance imaging phantom was used in this study (Elekta). The phantom was equipped with the three-dimensional inlay grid shown on the right.
CT (GE Discovery CT 750 HD, WI, USA), 1.5T MRI (GE Signa HDxt 1.5T, WI, USA), and 3.0T MRI (Philips ACHIEVA 3.0T TX, Eindhoven, The Netherlands) were used for this study. The MRI scanning parameters are shown in Table 1. Three sequences (T1 weighted images, T2, and FLAIR) were scanned by each MRI.
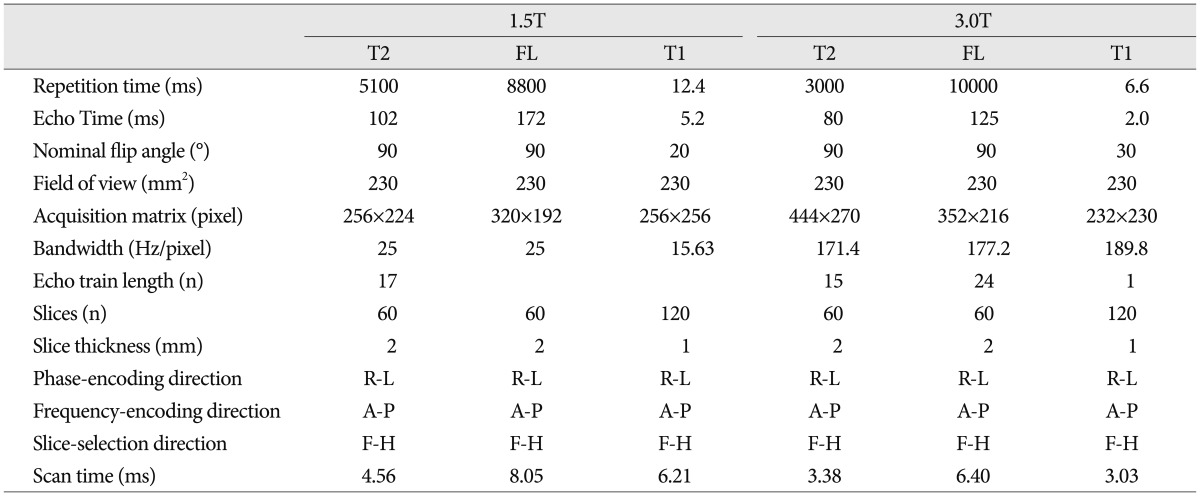
MRI scanning parameters
Accuracy evaluation in CT and MRI
The images obtained from the CT and MRIs were transferred to the Gamma Plan® workstation. And then two expert neurosurgeons defined the 3 dimensional coordinates (x, y, z). In the workstation, the coordinates were defined by manual mouse click with the maximal magnification view (Fig. 2). We obtained 190 sets of three-dimensional coordinates in each sequence. We assumed the CT images had no distortion error because they used X-rays. We also assumed that the error in transferring the images to the Picture Archiving and Communication System (PACS) was trivial. Therefore, we compared the coordinates of the MRI with those of the CT to figure out the errors of the MRI. We defined the error of each coordinate as such :

The 3-dimensional coordinates were defined with maximal magnification in the Gamma Plan® workstation. A and B : The phantom images transferred to the Gamma Plan® workstation. C : The defining coordinates with maximal magnification (arrows).
Δx=x coordinate in CT-x in MRI,
Δy=y coordinate in CT-y in MRI,
Δz=z coordinate in CT-z in MRI.
And the 3-dimensional error (Δr) was defined as a localization error :
Δr=√(Δx2+Δy2+Δz2).
We calculated all the errors in each sequence of the 1.5T and 3.0T MRIs.
First, we compared each coordinates in the CT images defined by a different expert neurosurgeon. Second, we compared the errors (Δx, Δy, Δz, and Δr) in the 1.5T and 3.0T MRIs according to the respective sequences. Third, we compared Δr in the 1.5T and 3.0T MRIs according to centrality since the central area in an MRI is considered as having lesser distortion than peripheral areas. We defined the central area as being within 20 mm from the center of the phantom images because almost all of the functional neurosurgery targets were in this area. Fourth, we compared the errors in each axis in the 1.5T and 3.0T MRIs according to the respective sequences. Last, we compared the errors in each sequence in the 1.5T and 3.0T MRIs according to the respective axes. We thought that we could figure out the accuracies of each of the sequences and each axis with the last two analyses.
Statistical analysis
We used MedCalc (version 12, MedCalc Software bvba, Belgium) to compare the errors of the coordinates. We calculated the errors in each set of coordinates arithmetically. Pearson correlation coefficient, with p-value was obtained to compare interpersonal differences. The 95% confidence interval for r was chosen. A paired t-test was used to compare the errors in all of the sequences of the 1.5T and 3.0T MRIs. Bonferroni's correction was done due to repeated performances of t-test. For these t-tests, corrected p-value <0.017 threshold level of significance was applied. To compare errors in each axis and each MRI sequence, we used the repeated measurement ANOVA test. And Tukey-Kramer post-hoc test was performed for statistically valuable test in ANOVA. For ANOVA, a p-value <0.05 threshold level of significance was chosen.
RESULTS
Interpersonal errors
Interpersonal errors are shown in Table 2. Pearson correlation coefficients and p-value were r=1.0 and <0.001, respectively in all axes. The mean error in the CT images between the two neurosurgeons (Δr) was 0.48±0.22 mm. The maximal error was 1.2 mm, which was in the y axis, and smallest error out of all the axes was 0.

Interpersonal errors in CT images
Comparison between the 1.5T and 3.0T MRIs
The errors in the 1.5T MRI were 1.55±0.48 mm (T1 sequence), 0.75±0.38 mm (T2), and 1.07±0.57 mm (FLAIR), and those in the 3.0T MRI were 2.35±0.53 mm (T1), 2.18±0.76 mm (T2), and 2.16±0.77 mm (FLAIR). Almost all of the differences between the 1.5T and 3.0T MRIs were statistically significant but Δz in T1, Δx in T2, and Δz in FLAIR were not. The p-values and the errors are shown in Fig. 3. The errors in the central area (within 20 mm from the center in the 3-dimensional space) showed statistically significant differences in all the sequences. These errors and p-values are shown in Fig. 4.
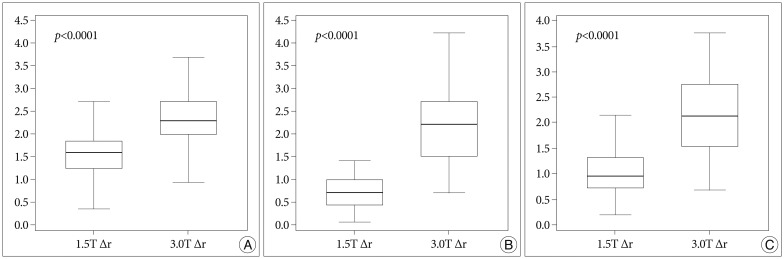
A : The errors (Δx, Δy, Δz, and Δr) in the T1 sequence of the 1.5T and 3.0T MRIs. B : The errors in T2. C : The errors in fluid attenuated inversion recovery. All p-values are corrected by Bonferroni's method.

The errors in the central area are shown in each MRI sequence. The difference between the 1.5T and 3.0T MRIs is statistically significant in all MRI sequences. All p-values are corrected by Bonferroni's method.
The errors according to the MRI sequences and axes
The range of mean errors of all coordinates in each MRI sequences were 0.3-1.20 mm (1.5T) and 0.43-1.78 mm (3.0T) in T1 sequence, 0.29-0.58 mm (1.5T) and 0.31-1.85 mm (3.0T) in T2, and 0.28-0.79 mm (1.5T) and 0.31-1.66 mm (3.0T) in FLAIR. The error in the T2 was the smallest out of all of the three sequences. The errors and p-values are shown in Fig. 5. For all MRI sequences, Tukey-Kramer post-hoc test were performed. Results of the differences between 1.5T and 3.0T MRI in all sequences were shown in Table 3.
The errors of all the axes are shown in each MRI sequence. The error in the x axis is the smallest regardless of the MRI sequence.

The differences between 1.5T and 3.0T MRI : the results of Tukey-Kramer post-hoc tests for positive results after ANOVA
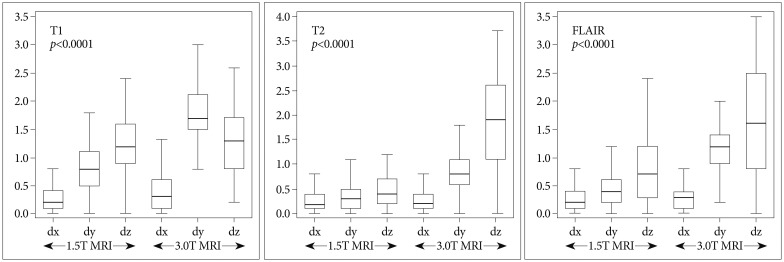
The range of mean errors of all coordinates in each axis were 0.28-0.34 mm (1.5T MRI) and 0.31-0.52 mm (3.0T) in the x axis, 0.36-0.98 mm (1.5T) and 0.66-1.78 mm (3.0T) in the y axis, and 0.40-1.20 mm (1.5T), and 1.30-1.85 mm (3.0T) in the z axis. The x axis showed no statistical significance. The errors and p-values are shown in Fig. 6. For y and z axes, Tukey-Kramer post-hoc tests were performed. And the results of the differences between 1.5T and 3.0T MRI in y and z axes were shown in Table 3.

The errors of all the MRI sequences are shown in each axis. The error in the T2 sequence is the smallest in the y and z axes. There is no difference in the x axis.
DISCUSSION
MRI accuracy
MRI has been the most accurate neuroimaging modality for showing details of the brain anatomy until now, and the technology including the various sequences have rapidly developed. High tesla MRI has been very useful as a diagnostic tool in clinical practice. However, distortion and accuracy of the MRI can be a concern in functional neurosurgery and radiosurgery. Some reports mentioned the accuracy and feasibility of MRI in radiosurgery8,18). The generally accepted accuracy of the 1.5T MRI is about 1 mm3,18). In our study, we knew that the difference between 1.5T and 3.0T MRI was various according to sequences and stereotactic axes. As shown in Table 3, the difference between 1.5T and 3.0T MRI was largest in z axis of T2 sequence. Among the all axes, the error was smallest in x axis and largest in z axis in both 1.5T and 3.0T MRI. However, among the all MRI sequences, the error in T2 sequence was not reliable in 3.0T MRI even though the error was smallest in 1.5T. We thought that the distortion of 3.0T MRI rapidly increased in z axis and T2 sequence.
The primary factor that introduces distortion in MRIs is the degree of homogeneity in the magnetic field and nonlinear magnetic field gradients13,17). Additional factors such as chemical shifts, strength of the magnetic field and the tissue susceptibility effect should be considered when it comes to discussing the accuracy of MRIs9,11,12). On a practical level, the most common artifact is caused by patient movement. However, patient factors and chemical shift artifacts, and tissue susceptibility effects did not need to be considered in our study. The lack of water or tissue of the brain in our study was able to minimize susceptibility artifacts that depend on the sequences. We focused on the acceptability of distortion of the 3.0T MRI in functional neurosurgery and stereotactic surgery.
In the early era of the MRI, some authors reported on the discrepancies between CT and MRI. Lunsford et al.10) reported that the difference in the x or y coordinate was 0-2 mm in a small number of patients. Bradford et al.2) reported that the mean differences in the x and y were 1.0 mm and 3.75 mm, respectively. Only a mean difference of 0.03 mm in the x coordinate and 1.7 mm in the y coordinate were reported by Andoh et al.1). Villemure et al.16) compared MRI and ventriculography in the x and y coordinates in patients who underwent functional neurosurgery and reported a difference of 0-3 mm16). The homogeneity in the MRI magnetic field may be interfered with by imperfect construction of the magnet by the manufacturer, a temporally fluctuating power supply, thermal instability, and internal or external ferromagnetic objects14). This inhomogeneity in the magnetic field could evoke distortions of the MRI and cause the discrepancy between MRIs and X-ray based imaging modalities. However, these mechanical problems, nowadays, have been solved to the point that there are no objections to the 1.5T MRI being accepted for use in frame-based stereotactic surgery. Even the 7.0T MRI recently showed relatively small hardware-related distortions, which may be acceptable for image coregistration or direct tissue-targeting procedures, although this very strong magnetic modality has still yet to used for scientific purposes4).
Choosing MRI sequences and the feasibility of the errors in the coordinates
The distortions of the MRI are dependent on imaging parameters including the specific pulse sequence, acquisition orientation, field of view (FOV), bandwidth (BW) and available distortion correction algorithms5,14,15). Our study had the limitation that only the corrected parameters in house were used for the MRI scan. The parameters were routine since quality assurance had been performed by radiologists and physicians and the maximal cost-effective ones were selected. We thought that using our routine parameters was meaningful because we have used these in real practice. Continuous quality assurance process in our institute should be performed to obtain more accurate and consistent images. In these settings, the T2 sequence of 1.5T MRI was thought to be the most reliable imaging because the errors in each MRI sequence of the T2 images were the smallest errors regardless of the coordinates. The errors in the x coordinates were the smallest in our study.
The centrality of the coordinates did not influence the degree of errors8). In our study, the differences between errors in the central area (<20 mm away from the center) and those in the peripheral areas were not statistically significant. It has been thought that inhomogeneity of the magnetic field according to the isocenter of the magnet in MRIs had been resolved. In fact, manufacturers of MRI provide distortion correction procedures as part of their standard acquisition. However, we thought that the overall errors in the 3.0T MRI had not been corrected enough.
Stereotactic references
All the stereotactic coordinates are defined based on stereotactic references. Hence, any deviations in the references would have direct implications on target accuracy. Geometric accuracy of the stereotactic references is absolutely paramount in any imaging technique19). In the literatures, the reference deviations in both the T1 and T2 sequences were similar in the 1.5T and 3.0T MRIs6,19). In our study, the deviation of the stereotactic references was not considered because it was generally within the acceptable error range. Besides, additional errors in each procedure step could be expected. In fact, the sum of errors in all the steps of the procedure during performance of radiosurgery or functional neurosurgery may be the real error. However, it was impossible to calculate the sum. We just tried to minimize the errors in the whole procedure.
CONCLUSION
There is no interpersonal difference in running a workstation to determine the stereotactic coordinates using a phantom. The distortion in the 3.0T MRI is bigger than in the 1.5T, and that is not acceptable regardless of the centrality in the coordinates. Among the stereotactic coordinates, the x coordinate has the least error regardless of the MRI sequences. And the T2 MRI sequence in 1.5T MRI has the smallest error regardless of the coordinates. Considering the biological effect of vessels, variable consistency of tissue, cerebrospinal fluid, etc on MRI distortion, more practical data obtained from future studies on real patients could support and clarify the experimental results of this study.
Acknowledgements
This work was supported by Grant from Inje University, 2010 (Hae Yu Kim). The work has been accepted for the Leksell Gamma Knife Society 2012 meeting.