Semi-Quantitative Analyses of Hippocampal Heat Shock Protein-70 Expression Based on the Duration of Ischemia and the Volume of Cerebral Infarction in Mice
Article information
Abstract
Objective
We investigated the expression of hippocampal heat shock protein 70 (HSP-70) infarction volume after different durations of experimental ischemic stroke in mice.
Methods
Focal cerebral ischemia was induced in mice by occluding the middle cerebral artery with the modified intraluminal filament technique. Twenty-four hours after ischemia induction, both hippocampi were extracted for HSP-70 protein analyses. Slices from each hemisphere were stained with 2,3,5-triphenyltetrazolium chloride (2%), and infarction volumes were calculated. HSP-70 levels were evaluated using western blot and enzyme-linked immunosorbent assay (ELISA). HSP-70 subtype (hsp70.1, hspa1a, hspa1b) mRNA levels in the hippocampus were measured using reverse transcription-polymerase chain reaction (RT-PCR).
Results
Cerebral infarctions were found ipsilateral to the occlusion in 10 mice exposed to transient ischemia (5 each in the 30-min and 60-min occlusion groups), whereas no focal infarctions were noted in any of the sham mice. The average infarct volumes of the 2 ischemic groups were 22.28±7.31 mm3 [30-min group±standard deviation (SD)] and 38.06±9.53 mm3 (60-min group±SD). Western blot analyses and ELISA showed that HSP-70 in hippocampal tissues increased in the infarction groups than in the sham group. However, differences in HSP-70 levels between the 2 infarction groups were statistically insignificant. Moreover, RT-PCR results demonstrated no relationship between the mRNA expression of HSP-70 subtypes and occlusion time or infarction volume.
Conclusion
Our results indicated no significant difference in HSP-70 expression between the 30- and 60-min occlusion groups despite the statistical difference in infarction volumes. Furthermore, HSP-70 subtype mRNA expression was independent of both occlusion duration and cerebral infarction volume.
INTRODUCTION
Focal cerebral ischemia is an active biochemical process that evolves over time and space. Depending on the duration and severity of ischemic injury, complex genomic responses can occur that determine cell survival6). Heat shock protein 70 (HSP-70) is a molecular chaperone that is induced by numerous pathologic insults such as hyperthermia, apoptotic stimuli, oxidative stress, and ischemic conditions9,25,26), and is particularly well known for its neuroprotective properties after acute ischemia4,5,20). HSP-70 is induced in the brain, and depending on the location and severity of ischemia, it can be induced in neurons, astrocytes, microglia, or endothelial cells15). Overexpression of HSP-70 protects cells against ischemic conditions by preventing protein denaturation, in addition to stabilizing and restoring the function of partially denatured proteins15). The HSP-70 chaperone family of proteins regulate both apoptotic and necrotic cell death5,13,23) and block apoptosis at several different steps in the pathway.
To investigate the relationship between the cerebral infarction volume and HSP-70 protein expression as well as between the duration of ischemia and the expression of HSP-70 protein, we used mice in whom focal cerebral ischemia was created by transient middle cerebral artery occlusion (MCAO). Experimental induction of focal ischemia in mice via intraluminal suture-occlusion of the middle cerebral artery was first developed by Koizumi et al. and further modified by Longa et al.8) and Nagasawa and Kogure12). This noninvasive and simple model has been used extensively for cerebral ischemic pathophysiology studies and therapeutic interventions. Although a large amount of research on the relationship between cerebral infarction and HSP-70 expression has been performed, there is inadequate research effort in examining HSP-70 expression using various methods [western blot and enzyme-linked immunosorbent assay (ELISA)] and the mRNA expression of HSP-70 subtypes (hsp70.1, hspa1a, and hspa1b) after reperfusion in the acute stage of an infarction model.
By creating focal ischemia using the MCAO method and measuring HSP-70 levels directly from the hippocampal tissues of mice, we aimed to further analyze the relationship between HSP-70 expression and ischemic infarction in terms of ischemic duration and infarction volume. We sought to determine the significance of HSP-70 in clinical applications as a tool that may assist in the diagnosis and prognosis of cerebral ischemia as well as in evaluating the efficacy of treatments for these diseases.
MATERIALS AND METHODS
Animals
Fifteen adult male C57BL/6 mice weighing 23 g to 25 g (7-8 W) were used in the present study. Mice were randomly assigned to 3 groups : 5 mice to the 30-min MCAO group, 5 mice to the 60-min MCAO group, and another 5 mice to the sham group. The Institutional Animal Care and Use Committee at the University of Korea reviewed and approved the animal protocols used in this work.
Focal cerebral ischemia and brain section preparation
Focal cerebral ischemia in mice was induced by occluding the middle cerebral artery (MCA) using a modified intraluminal filament technique1). After a midline neck incision, the left common and external carotid arteries were isolated and ligated, and a microvascular clip was temporarily placed on the internal carotid artery. An 8-0 nylon monofilament coated with silicon resin was introduced through an incision in the common carotid artery and was advanced 9 mm distal to the carotid bifurcation for occlusion of the MCA. The nylon monofilament was retrieved after 30-min in the 30-min MCAO group and after 60-min in the 60-min MCAO group. Mice in the sham group received a midline neck incision as well as left common and external carotid artery-isolation and ligation, but no further manipulations. The size of the thread was matched to the body weight to assure reproducible vascular occlusion.
Mice were killed 24 h after the operation, and their brains were processed in 2 ways : both hemispheres were sectioned into 3 slices, each 1.5-mm thick, to measure the infarct volume, and brain tissues from bilateral hippocampi were promptly extracted for HSP-70 protein analyses.
Measurement of cerebral infarction volume
All 15 mice were used for infarction volume measurements. Brains were removed and cut into 1.5-mm-thick axial slices. Slices were placed into a 2% solution of 2,3,5-triphenyltetrazolium chloride and warmed to room temperature for 20 min. Slices were then treated with paraformaldehyde (4%) and refrigerated at 4℃ for 48 h before scanning. The infarct area of each section was measured using National Institutes of Health (NIH) ImageJ software version 9.0 (Bethesda, MD, USA), and the total infarct volumes were calculated. Ipsilateral and contralateral hemisphere volumes were also determined to correct for edema, which can artificially affect the infarct volume19). The following formula was used to calculate the edema-corrected infarct volume : corrected infarct volume=contralateral non-infarction volume-ipsilateral non-infarct volume.
Western blot analyses
For western blot analyses, both hippocampi of all the mice from each of the experimental groups were obtained. Protein extraction, sodium dodecyl sulfate-polyacrylamide gel electrophoresis (SDS-PAGE), and western blot were performed based on the manufacturer's instructions10,21). Equivalent amounts of protein were separated using 8% SDS-PAGE and transferred to PVDF membranes, followed by immunoblotting with the primary antibody. Primary antibodies used were as follows : anti-β-actin [F-1804 (Sigma, USA, 1 : 4000)] and HSP-70 [sc-32239 (Santa Cruz Biotechnology, Santa Cruz, CA, USA, 1 : 500)]. The intensities of the HSP-70 and β-actin protein bands were quantified from at least 5 independent experiments using NIH ImageJ software version 9.0 and normalized to β-actin.
HSP-70 ELISA analyses
For HSP-70 ELISA, hippocampi were snap-frozen in liquid nitrogen and weighed. Samples were homogenized for 15 s using a tissue homogenizer (Omni International, TH2000), followed by the addition of 50 µL of cold (4℃) 1×extraction buffer from the HSP-70 ELISA kit (Abcam, ab133060; Abcam, Cambridge, MA, USA). Following 30-min incubation on ice, samples were sonicated on level 7 with 12 pulses (Sonic Dismembrator 60; Fisher Scientific, Chicago, IL, USA) and centrifuged for 10 min at 21000×g in a 4℃ refrigerated microfuge. The supernatant was diluted 1 : 5 in sample diluent 2 (a component in HSP-70 ELISA kit); 100-µL duplicates were used in the ELISA, and the remaining supernatant was used for protein assays. Excess supernatant was stored at -70℃. The protocol provided with the HSP-70 ELISA kit was followed without any modifications for the quantification of HSP-70 protein levels. A µQuant (Bio-Tek Instruments, Inc., Winooski, UT, USA) was used to measure absorbance at 450 nm, and data were analyzed using Ascent for µQuant.
Reverse transcription-polymerase chain reaction
For RT-PCR, bilateral hippocampi from all subjects were extracted using the same method as described above. Total RNA was extracted using the Trizol reagent and reverse transcribed using a complementary DNA (cDNA) synthesis kit (Invitrogen, USA) according to the manufacturer's instructions. The fidelity and specificity of sense and antisense oligonucleotides were tested using BLAST (NIH, Bethesda, MD, USA). cDNA was synthesized using a DNA thermal cycler (Perkin Elmer) with the following parameters : 60-min at 45℃, followed by 5-min at 95℃. cDNA (2 µL) was amplified with Taq polymerase (Promega, USA) and 10 pmol each of sense and antisense primers as follows : GAPDH : 5'-TGT GTC CGT CGT GGA TCT GA-3', 5'-CCT GCT TCA CCA CCT TCT TGA-3'; HSP 70.1 : 5'-TGC TTG GGC ACC GAT TAC TGT CAA GG-3', 5'-GCA GCT AGA CTA TAT GTC TTC CCA GGC TAC TG-3'; HSPa1a : 5'-TCA ACG GGC GCG ACC TGA AC-3', 5'-GCC ACA TAT CTG TCT CCT AGC CAG C-3'; and HSPa1b : 5'-TCA ACG GGC GCG ACC TGA AC-3', 5'-TCG GTG CCC AAG CAG CTA TCA-3'. cDNA levels were normalized using glyceraldehyde-3-phosphate dehydrogenase (GAPDH) as reference. PCR products were electrophoresed through a 1% agarose gel, and bands were visualized using GelStar gel staining (FMC BioProducts, Rockland, ME, USA). Invariant GAPDH mRNA was used as an internal control.
Statistical analyses
Statistical analyses were performed using the Statistical Package for the Social Sciences version 18.0 for Windows (SPSS Inc., Chicago, IL, USA). Continuous and categorical variables were presented based on the average [± standard deviation (SD)] and the frequency (n and percentage), respectively. Kruskal-Wallis tests and the Mann-Whitney U-tests were used to compare the distributions of continuous variables among groups according to normality tests. Two-tailed hypothetical tests were used, and a value of p<0.05 was considered statistically significant in all analyses.
RESULTS
Measurement of cerebral infarction volume
Cerebral infarctions were found in the hemisphere ipsilateral to the occlusion (left side) in animals that were exposed to transient ischemia (5 mice from the 30-min ischemia group and 5 mice from the 60-min ischemia group), whereas no focal infarction was noted in mice from the sham group (n=5) (Fig. 1A).

A : Infarct areas are shown as pale (unstained) regions after 2,3,5-triphenyltetrazolium chloride staining. B : Quantitative analyses of infarct volumes at 30-min or 60-min after middle cerebral artery occlusion. The infarct volumes at 60-min are significantly larger than the volume at 30 min (Mann-Whitney U-test, p=0.032). Lt : left.
Based on the data from the mice in the 2 groups that had infarctions, cerebral infarction volume increased with MCA occlusion time. The average infarct volumes were 22.28±7.31 mm3 in the 30-min occlusion group (n=5) and 38.06±9.53 mm3 in the 60-min group (n=5), showing that the infarct volumes were greater in the group that experienced ischemia for a longer time. Comparison of infarct volumes showed a statistical difference between the 30- and 60-min MCAO groups (p=0.032) (Fig. 1B).
Western blot analyses
We processed bilateral brain samples from 15 mice for protein measurement (ipsilateral n=15, contralateral n=15). However, 1 sample from the ischemic side (left) in the 30-min ischemia group was unsuitable for analysis due to a flaw in the HSP-70 protein band. Therefore, 29 protein bands were analyzed : 14 ipsilateral protein bands and 15 contralateral protein bands.
Western blot analyses confirmed a significant increase in the ratio of HSP-70 to β-actin processed from ipsilateral (left) hippocampal tissues in both the infarction groups (30- and 60-min occlusion groups) compared to the sham group (sham group, n=5, 30-min group, n=4, 60-min group, n=5) (p=0.034).
However, there was no statistically significant difference in the level of HSP-70 between the 2 infarction groups (p=0.730). Using contralateral (right) hippocampal tissues, the ratio showed no significant change relative to different occlusion times (p=0.792). Finally, the expression of HSP-70 was greater in the tissue from an ipsilateral (left) side than that from the contralateral (right) when viewed in each subject (Fig. 2).
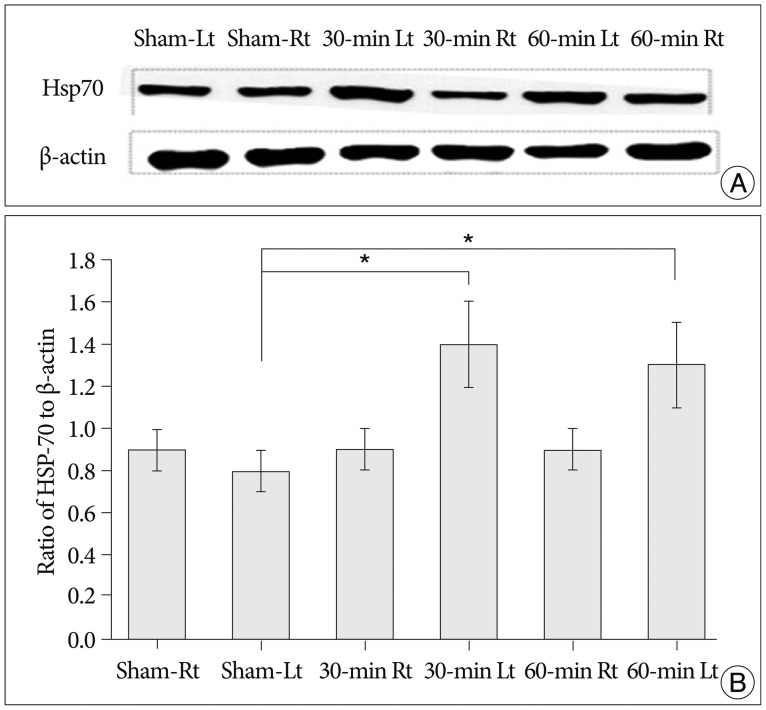
Western blot (A) and quantitative analysis (B) show statistical differences in HSP-70 expression between the ischemic groups (30- and 60-min) and the sham group in the ipsilateral (left, Lt) hippocampi of the mice (Kruskal-Wallis tests, p=0.034), whereas that between the 30- and 60-min groups does not (p=0.730). No statistical differences are noted in the contralateral (right, Rt) side (Kruskal-Wallis tests, p=0.792). Data are expressed as the mean±SD. *Significance at p≤0.05. HSP-70 : heat shock protein 70, SD : standard deviation.
HSP-70 ELISA analyses
Similar to the western blot results, ELISA demonstrated an increase in the expression of HSP-70 in both infarction groups than in the sham group, when performed on hippocampal tissues ipsilateral to the occlusion (sham group : n=5, 30-min group : n=5, 60-min group : n=5) (p=0.011). However, there was no significant difference in HSP-70 expression level between the 30- and 60-min occlusion groups (p=0.971) despite increased infarction volumes with longer occlusion times. No statistical difference in HSP-70 expression between the groups was found when processing contralateral (right) hippocampal tissues, even for the group that underwent the longest occlusion time (p=0.058). Finally, HSP-70 expression was greater in tissue from the affected (left) side compared to the contralateral (right) side, when viewed in each animal from the 30- and 60-min occlusion groups (Fig. 3).

ELISA quantitative analyses. Statistical differences in HSP-70 expression between the ischemic groups (30- and 60-min) and the sham group in the ipsilateral (left, Lt) hippocampi of mice are evident (Kruskal-Wallis tests, p=0.011), whereas that between the 30- and 60-min groups are not (p=0.971). No statistical differences are noted in the contralateral (right, Rt) side (Kruskal-Wallis tests, p=0.058). Data are expressed as the mean±SD. ELISA : enzyme-linked immunosorbent assay, HSP-70 : heat shock protein 70, SD : standard deviation.
RT-PCR analyses
We measured the relative mRNA expression of GAPDH, hsp70.1, hspa1a, and hspa1 from hippocampal tissues obtained from both hemispheres (sham group : n=5, 30-min group : n=5, 60-min group : n=5). Quantitative analyses revealed no significant differences for the mRNA expression of the different HSP-70 subtypes (hsp70.1, hspa1a, hspa1b) between the groups that underwent different vascular occlusion times (sham, 30-min, and 60-min).
Upon comparing the data obtained from the infarcted hemispheres (ipsilateral to the vascular occlusion) using RT-PCR, we did not observe any significant differences in the expression of hsp70.1 (p=0.379), hspa1a (p=0.264), and hspa1b (p=0.33) mRNAs with regard to different occlusion times. We obtained the same negative results for contralateral (right) brain samples (hsp70.1, p=0.512; hspa1a, p=0.852; and hspa1b, p=0.932) (Fig. 4).

HSP mRNA expression (hsp70.1, hspa1a, and hspa1b) is not dependent on MCA occlusion time (Kruskal-Wallis tests, p>0.05). Data are expressed as the mean±SD. No significant differences in HSP mRNA expression (hsp70.1, hspa1a, hspa1b) in the bilateral (Rt : contralateral, Lt : ipsilateral) hippocampi of mice are evident (Kruskal-Wallis tests, p>0.05). Data are expressed as the mean±SD. HSP : heat shock protein, mRNA : messenger RNA, MCA : middle cerebral artery, SD : standard devicetion.
DISCUSSION
The notion that HSP-70 expression increases in ischemic conditions is well established15). It is known that the action of heat shock genes is triggered by heat shock or various stresses, including ischemia3,11,22). Denatured proteins produced in stressful conditions trigger HSP transcription, and the resultant HSP-70 binds denatured proteins to prevent further denaturation14,27). Yenari24) suggested that the increased expression of HSP-70 is an indicator of cellular stress. HSP-70 expression is elevated predominantly in the ischemic penumbra area17,18), and deletion of the HSP-70 gene exacerbates apoptosis after focal cerebral ischemia in mice7). It has recently been demonstrated that HSP-70 protects the brain against ischemia via an anti-inflammatory mechanism4).
We postulated that HSP-70 expression would be higher in severe cerebral ischemia. The concentration of HSP-70 was directly assessed by measuring its level in hippocampal tissues, and the severity of cerebral ischemia was represented by the duration of ischemia and the infarction volume. First, our data showed that cerebral infarction volume differs depending on the duration of ischemia : the longer the ischemia duration, the larger the infarction size. Secondly, it was evident that HSP-70 expression increased only in tissues from ischemic territories of the brain.
However, although there was a significant difference in infarction volumes between the 2 groups that underwent different durations of vascular occlusion (30- and 60-min), no statistical difference in HSP-70 expression was observed. No significant difference in HSP-70 expression between the 2 groups was consistent in all of the analyses (western blot, ELISA, and RT-PCR assays). These results did not match our predictions or expectations, particularly because we observed that an increase in infarction severity was proportional to the increase in occlusion time. We presume that this is a consequence of the exceptional vulnerability of the hippocampus to ischemia2) such that HSP-70 mRNA degraded over time when introduced to ischemia for longer than 30-min, resulting in no distinction between the 30- and 60-min groups.
Unlike our result, Roberts et al.16) showed that the levels of HSP-70 in unfractionated hippocampus at 24-h reperfusion were proportional to the duration of ischemia, with longer ischemia times increasing HSP-70 production. In their study, however, the vascular occlusion durations were shorter (10-, 15-, and 20-min).
An mRNA expression is a strong evidence of protein production26). To examine meaningful changes in HSP-70 induction, we analyzed mRNA expression of 3 different HSP-70 subtypes, hsp70.1, hspa1a, and hspa1b. However, our data showed that the expression of hsp70.1, hspa1a, and hspa1b mRNAs were unchanged regardless of vascular occlusion duration and cerebral infarction volume.
These results may have occurred due to the following reasons : 1) inappropriate reperfusion duration after a vascular occlusion, and 2) no separate analyses of different hippocampal cells. Yenari24) conducted a study using a global model of cerebral ischemia in mice and noted a change in HSP-70 mRNA expression in the CA1-CA3 regions of the hippocampus. These authors reported that HSP-70 mRNA expression varied according to different reperfusion durations after occlusion, with its peak expression 18 h after reperfusion, and a reduction at 30 h16). This suggests that our focal infarction model possibly failed to show increases in mRNA expression, as seen in the measurement of HSP-70 protein levels. Furthermore, the lack of separate analyses of cells in the CA1 and CA3 regions of the hippocampus may have affected our results. Separate microdissection of CA1 and CA3 with subsequent microscopic analyses may bring promising results. Another limitation to our study is insufficient sample size. We may need to collect additional data to enhance the statistical value.
In addition to addressing the above-mentioned limitations, further studies that investigate meaningful HSP-70 subtypes are required to discover useful serologic markers for the diagnosis and treatment of ischemic injuries.
CONCLUSION
Our results are consistent with data from several recent studies that demonstrated that HSP-70 overexpression depends on cerebral infarction volume. If a change in the serum levels of a specific HSP-70 subtype can be detected and correlated to ischemia, this could be useful in the diagnosis of ischemic injury. Moreover, should serological or gene transfer approaches prove effective in inducing increased HSP-70 levels, these methods could be useful in the treatment of focal ischemic injury in stroke patients. HSP-70 levels can be used to enable more precise diagnosis of acute focal cerebral infarction in terms of reperfusion. However, further in vitro methods are required to demonstrate that HSP-70 is an important marker for the severity of cerebral infarction, treatment efficacy, and prognosis.
Acknowledgements
This study was supported by a Korea University Grant, K1300161.