A New Measure for Monitoring Intraoperative Somatosensory Evoked Potentials
Article information
Abstract
Objective
To propose a new measure for effective monitoring of intraoperative somatosensory evoked potentials (SEP) and to validate the feasibility of this measure for evoked potentials (EP) and single trials with a retrospective data analysis study.
Methods
The proposed new measure (hereafter, a slope-measure) was defined as the relative slope of the amplitude and latency at each EP peak compared to the baseline value, which is sensitive to the change in the amplitude and latency simultaneously. We used the slope-measure for EP and single trials and compared the significant change detection time with that of the conventional peak-to-peak method. When applied to single trials, each single trial signal was processed with optimal filters before using the slope-measure. In this retrospective data analysis, 7 patients who underwent cerebral aneurysm clipping surgery for unruptured aneurysm middle cerebral artery (MCA) bifurcation were included.
Results
We found that this simple slope-measure has a detection time that is as early or earlier than that of the conventional method; furthermore, using the slope-measure in optimally filtered single trials provides warning signs earlier than that of the conventional method during MCA clipping surgery.
Conclusion
Our results have confirmed the feasibility of the slope-measure for intraoperative SEP monitoring. This is a novel study that provides a useful measure for either EP or single trials in intraoperative SEP monitoring.
INTRODUCTION
Evoked potentials (EP) indicate the neurophysiological resp-onses to the presentation of a stimulus, and somatosensory evoked potentials (SEP) are one of the widely utilized technique to monitor sensory function14). In terms of the clinical application of EP, intraoperative neurophysiological monitoring (IOM) using EP techniques has grown from an interesting investigational procedure into a widely used method to protect patients from neurological injury during surgery over the last three decades15). For IOM, SEPs are nowadays routinely used to monitor whether the sensory tract is intact in procedures in which the brain, spine and peripheral nerves are at risk6).
Regarding EP analysis, the amplitude and latency of a peak component have been used as characteristic markers representing neuronal responses to a given stimulation. For instance, cortical N20 and P25 peaks generated from the primary somatosensory cortex are the two main responses to upper extremity stimu-lation3). During SEP monitoring, if a 50% decrease of amplitude and/or 10% delay of latency compared to the baseline value appear, a warning alarm for SEP changes goes off so that the surgeon is aware that the procedure at that time may be a danger to the sensory tract7,9,16,18,23). Alarms can go off for a 30% decrease in N20, because such a degree of amplitude drop is uncommon among the well-defined N20 peaks16,17). The decreases in the peak-to-peak amplitude between the N20 and P25 peaks and the increase in latency have been used as an alarm criterion6). It should be noted that no matter which alarm criterion is used, the alarm criterion is comprised of two independent markers for the amplitude and latency. However, when reminded of the fact that the main goal of IOM during surgery is to reduce the risk of loss of function before being permanently damaged by observing the function of neural structures8,12,15), one of the virtues of good SEP monitoring would be the prompt detection of a SEP change, which would make it easy for a surgeon to be aware of the potential risk. In that sense, focusing on one marker for EP change detection would be beneficial rather than dividing the concentration of a monitoring technician into two markers with a different criterion.
An averaging technique is usually used to produce a time-locked SEP signal and to acquire the amplitude and latency at the peaks3,12,16). In most cases, hundreds of trials are averaged to obtain a SEP signal, which subsequently requires a certain amount of time to calculate the SEP. For instance, it takes about 34.5 s with a stimulus frequency of 2.9 Hz and 100 sweeps. Various approaches have been reported to overcome this disadvantage by reducing the number of trials1,4,6,7,22). Therefore, in addition to the capability of focusing on one marker for EP change as mentioned above, a measure for intraoperative SEP monitoring with a small number of trials would also be advantageous.
In the present study, we introduce a new method for IOM in terms of early detection of SEP changes by monitoring only one marker. The motivation of this study was to make one representative marker for the SEP peak for early detection of significant changes followed by the warning alarm. The main aims of the present study were to introduce a new measure for effective intraoperative SEP monitoring defined as the relative slope of the amplitude and latency compared to the baseline value, and to apply the measure to both EP obtained by the averaging technique and single trials after being processed by optimal filters to determine whether the application of the new measure to EP and single trials is feasible. To this end, retrospective data analyses of SEP monitoring during cerebral aneurysm clipping surgery were performed with the conventional method and our new proposed method.
MATERIALS AND METHODS
Patients
Seven patients [age at surgery, 62.56±8.32 (mean±SD) years; 6 females] who underwent cerebral aneurysm clipping surgery for unruptured aneurysm middle cerebral artery (MCA) bifurcation between May 2012 and December 2012 at our hospital were included in our retrospective data collection. Because the application of a temporary or main clip to a cerebral aneurysm can sometimes cause cerebral ischemia yielding SEP changes9,17,18,23), patients who underwent cerebral aneurysm clipping surgery were selected to evaluate the proposed method. This study was approved by the Institutional Review Board (H-1304-013-477). The details of each patient are presented in Table 1.

Characteristics of patients including age, gender, and diagnosis
The protocol for intraoperative monitoring
General anesthesia was induced with propofol (2 mg/kg) and remifentanyl (1 µg/kg). Muscle relaxant was given once before intubation and not given thereafter. Intraoperatively, propofol was maintained at 2-10 mg/kg/hr and remifentanyl at 15 µg/kg/hr. The mean blood pressure was maintained higher than 90 mm Hg.
A commercially available intraoperative monitoring system (Eclipse, Axon Systems, Inc., New York, NY, USA) was used for the stimulation of the median nerve and recording SEP signals. The median nerve was stimulated by surface electrodes at the wrist of the patients contralateral to the site of surgery10). The SEP contralateral to the stimulation was analyzed. Stimulation was achieved with a 200 µs square-wave electrical pulse presented sequentially to the median nerve at a rate of 2.9 Hz. The stimulus intensity ranged from 16 to 40 mA. SEP recording was performed using needle electrodes placed on the scalp at locations C3 (right median nerve stimulation) and C4 (left median nerve stimulation) based on the international 10-20 system.
The data were recorded at a 10000 Hz sampling rate yielding 1000 samples per signal. The 60 Hz notch filter was kept off during the data acquisition. Filters were set at 30 Hz and 1000 Hz, and the average was obtained using the frequencies between 30 Hz and 150 Hz displayed on a monitoring screen. A built-in automatic artifact rejection procedure implemented in the Eclipse software was also applied to reduce the noise. The SEP signals after being processed by the above-mentioned procedures were then analyzed retrospectively using custom-built in-house scripts with MATLAB (version 7.10; Math Works Inc., Natick, MA, USA).
Slope-measure
Notch filtering
Because the 60 Hz notch filter can interact with the stimulus signal itself, this filter is kept off during data acquisition16). However, 60 Hz noise is often seen in SEP trials. This artifact corrupts the signal in such a way that sometimes it is impossible to clearly detect the SEP6). To remove the 60 Hz noise from the acquired signal, a second-order infinite impulse response notch digital filter was used.
Moving average filter
A single trial is always contaminated with noise components. Digital filters can be used to restore the signals that have been distorted in some way20). Here, because smoothing in the time domain is the major procedure required, we applied a moving average filter carried out by convolution (also called finite impulse response or FIR) in the time domain. The moving average is the most common filter with the advantage of simplicity, but it is optimal for the common task of reducing noise while retaining a sharp step response20). Therefore, this filter would be optimal for noise reduction in a single trial SEP because SEP is basically a time-lock-ed signal. The moving average filter operates by averaging a number of points from the input signal to produce each point in the output signal calculated with the following equation :

Slope-measure calculation
We defined the slope-measure as the relative slope of the amplitude and the latency at each EP peak compared to the baseline value, which is sensitive to change in both the amplitude and latency of the EP. The basic idea was to make and monitor one marker for each peak component. Currently, the amplitude and latency are used as markers to monitor the neural responses to a stimulus, and these two markers have different alarm criteria, as mentioned above. Let us imagine the Cartesian coordinate system with the latency on the x-axis and the amplitude on the y-axis, which is the same plane as the data acquisition system. A decrease in amplitude and an increase in latency always occur with a slope change of the amplitude and latency in the plane containing the x and y axes, which implies the possibility of using one marker for SEP monitoring or for an alarm bell. Moreover, it is simply defined with the amplitude and latency as follows :

If there are changes in the amplitude or latency at a certain trial compared to the baseline value, these changes in the relative slope can be reflected in the slope-measure immediately. That is, if the slope-measure value is smaller than 0.7, it can be interpreted that there is a 30% decrease in the slope of the amplitude and latency compared to the slope of the baseline.
Fig. 1 depicts a general flow diagram of SEP detection showing the steps in the SEP change detection process. The baseline EP was determined with a single trial dataset of 100 trials. After determining the baseline value, single trials were collected when the monitoring was started. When 100 trials were collected and then averaged, finally, the SEP was calculated along with using the conventional method, that is, a decrease in the peak-to-peak amplitude and an increase in the latency. Slope-measure values were calculated for each SEP component after 100 trials. In addition, the slope-measure at each single trial after applying filters was also calculated to determine whether the slope-measures of the single trials could be applicable to SEP monitoring.

Flow diagram of SEP detection and slope-measure application. Baseline value was determined before the main surgery, and when starting the surgery, the monitoring began. The slope-measure value of the EP was calculated after 100 trials, and the slope-measure values of the single trials (STs) were calculated for every single trial after applying a moving average filter. SEP : somatosensory evoked potentials, EP : evoked potentials.
Evaluation
In order to evaluate the algorithm, the detection time at the point of warning was calculated and the results obtained from the different methods, which included the conventional peak-to-peak amplitude, the slope-measure of the EP, and the slope-measures of single trials were compared. Because we accepted the warning criteria as a decrease of more than 30% in the amplitude and/or an increase of more than 10% in the latency compared to the baseline values as in a previous study17), the common warning criteria accepted in this study was a 30% decrease in the slope-measure of the EP or single trials.
We applied the slope-measure to each EP component, i.e., N20 and P25. The significant change detection time was determined when a percent decrease of more than 30% (corresponding to a slope-measure value less than 0.7) compared to the baseline appeared at either the slope-measure value for the N20 or P25 peak, or both peaks. As for the single trials, we accepted it as a warning alarm time only when a 30% decrease in the slope-measure persisted for at least 3 seconds, because a decrease in the slope-measure for too short a time would be a transitory change, which might not be a real sign of possible damage to the neural system.
Fig. 2 shows one example (Subject 1) of the whole analysis process and the determination of a significant change in the detection time or warning alarm time. As described in Fig. 1, the baseline value was determined before starting the surgery. SEP moni-toring results with the conventional method was obtained from the ratio between the peak-to-peak amplitude and the baseline value shown in Fig. 2A. During the surgery, each EP trial and single trial were recorded, and the slope-measure values were calculated for each EP peak (Fig. 2B) and single trial peaks after being processed by filters (Fig. 2C).
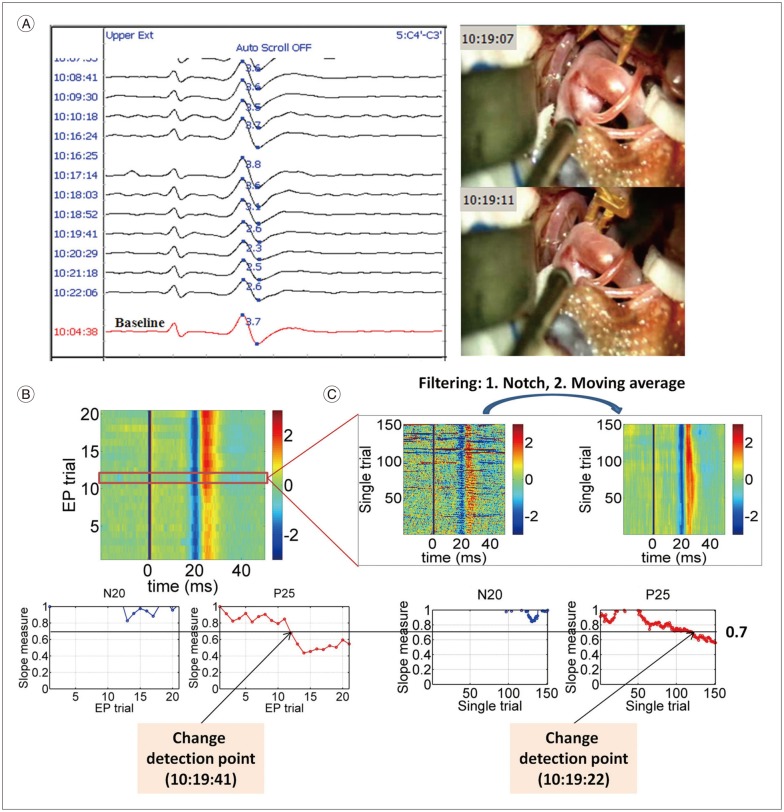
Analysis process at the left upper extremity from Subject 1. A : The raw SEP monitoring data along with the video capture of the temporary clipping from Subject 1. Baseline (the red signal at the bottom) was determined at 10 : 04 : 38, and the peak-to-peak amplitude value at baseline was 3.7 (the blue figure on the baseline signal). The significant change with the conventional method was detected at 10 : 20 : 29 (2.3/3.7, i.e., 37.84% decrease to the baseline). A temporary clip was applied between the times 10 : 19 : 07 and 10 : 19 : 11. B : EP signals as a function of time (upper subpanel). In the upper subpanel, blue and red colors mean negative and positive voltage, respectively, and baseline signal corresponds to the first EP trial. In the lower subpanels, slope-measure values as a function of the EP trial of the N20 and P25 components were plotted. In this case, a significant change in the slope-measure of the EP was detected at 10 : 19 : 41 (45.45% decrease to the baseline). C : Single trials signals as a function of time (upper subpanel). The noise in the single trials was remarkably reduced by applying filters. In the lower subpanels, slope-measure values as a function of the single trial of the N20 and P25 components were plotted. In this case, a significant change in the slope-measure of the single trial was detected at 10 : 19 : 22 (37.59% decrease to the baseline). SEP : somatosensory evoked potentials, EP : evoked potentials.
RESULTS
Table 2 presents the significant change in detection times for the 3 types of measures : the conventional method, the slope-measure of the EP, and the slope-measure of the single trials. Note that as mentioned above, a significant change was defined as a decrease of more than 30% compared to the baseline value regardless of the type of applied method.

Significant change detection time and percentage decrease compared to the baseline with the different methods : conventional peak-to-peak amplitude, slope-measure of the EP, slope-measure of the single trials for each patient
Fig. 3 show the stack windows from Subject 2 to Subject 7 showing the EP signals recorded during the cerebral aneurysm clipping along with the video capture or the comments for the temporary clippings written by the technician. The stack window of Subject 1 is shown in Fig. 2A.
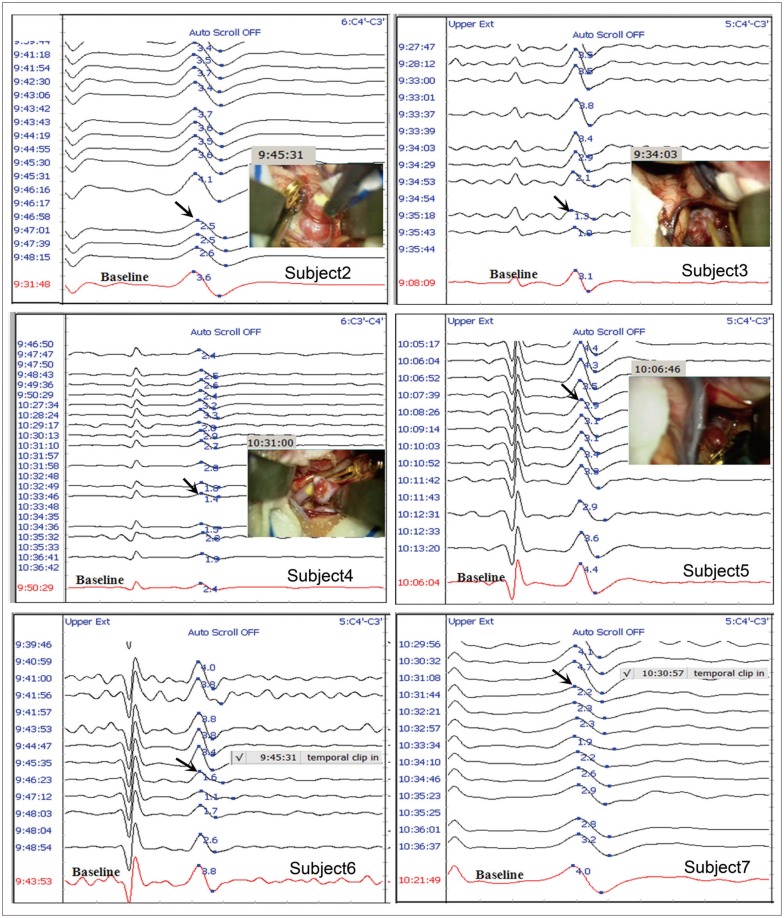
Raw SEP data and video capture or comments showing the temporary clipping time at the contralateral upper extremity to the aneurysm from Subject 2 to Subject 7. The red signal at the bottom in each sub-graph corresponds to the baseline. The number in blue font on the baseline signal indicates the conventional peak-to-peak amplitude. The black arrow indicates a significant SEP change. SEP : somatosensory evoked potentials.
Putting together these figures and the results of the detection times described in Table 2, it should be noted that the detection times using the conventional method were found after temporary clipping in all patients. The raw SEP monitoring data along with analysis results calculated in MATLAB from each subject is available in the supplementary materials. The slope-measure of the EP detected significant changes earlier than that of the conventional method in Subjects 1, 3, and 4 (‡ marked in Table 2). In Subjects 2, 5, 6, and 7, the slope-measure of the EP had the same detection time as the conventional method († marked in Table 2). The slope-measure of the single trials detected significant changes earlier than that of the conventional method in all 7 cases.
In Subject 1, the baseline was set at 10 : 04 : 38 and the significant change detection time based on more than a 30% decrease was seen at 10 : 20 : 29. When the slope-measure for each EP trial was applied, the significant change detection time was 10 : 19 : 41 (45.45% decrease to the baseline), which is 48 sec earlier than that for the conventional method. When looking at the slope-measure values of the single trials, the significant change detection time was 10 : 19 : 22 (37.59% decrease to the baseline), which is 67 sec earlier than that for the conventional method.
In Subject 2, the significant change detection time was seen at 09 : 47 : 01 with the conventional method. The significant change with the slope-measure of the EP was detected at the same time as the conventional method. However, the significant change of the slope-measure for the single trials was detected at 09 : 46 : 31, 30 sec earlier than that for the conventional method.
In Subject 3, the significant change detection time was seen at 09 : 35 : 18 with the conventional method. The significant changes with the slope-measure of the EP and single trials were detected at 09 : 34 : 29 and at 09 : 34 : 13, 49 sec and 65 sec earlier than that for the conventional method, respectively.
In Subject 4, the significant change detection time was seen at 10 : 33 : 46 with the conventional method. The significant changes with the slope-measure of the EP and single trials were detected at 10 : 31 : 58 and at 10 : 32 : 15, 108 sec and 69 sec earlier than that for the conventional method, respectively.
In Subject 5, the significant change detection time was seen at 10 : 08 : 26 with the conventional method. The significant change with the slope-measure of the EP was detected at the same time as the conventional method. However, the significant change of the slope-measure of the single trials was detected at 10 : 07 : 17, 69 sec earlier than that for the conventional method.
In Subject 6, the significant change detection time was seen at 09 : 46 : 23 with the conventional method. The significant change with the slope-measure of the EP was detected at the same time as the conventional method. However, the significant change of the slope-measure of the single trials was detected at 09 : 45 : 35, 48 sec earlier than that for the conventional method.
In Subject 7, the significant change detection time was seen at 10 : 31 : 44 with the conventional method. The significant change with the slope-measure of the EP was detected at the same time as the conventional method. However, the significant change of the slope-measure of the single trials was detected at 10 : 31 : 06, 38 sec earlier than that for the conventional method.
DISCUSSION
In the present study, we introduced a measure for intraoperative SEP monitoring in terms of early detection of SEP changes with one marker unlike the conventional method that employs two independent measures with different warning criteria. We presumed that one marker taking into account both the amplitude and latency information can be applied to intraoperative SEP monitoring. A new measure, the so called slope-measure, defined by the relative slope of the latency and amplitude to the baseline value was proposed. We found that this simple slope-measure derived from the conventionally used two independent mar-kers has a detection time that is as early or earlier as that of the conventional method during MCA clipping surgery. In addition to its good performance quality, the strength of this measure is that it allows us to focus on one marker representing EP peak change unlike the conventional method with two markers. Our results have shown the feasibility of the slope-measure for intraoperative SEP monitoring. It should also be noted that the quality of the detection performance of the slope-measure of the EP and single trials was better than or equal to that of the conventional method.
Feasibility of the slope-measure as a marker for an intraoperative SEP monitoring
As for the slope-measure, the basic idea is that the changes in amplitude and latency in the Cartesian coordinate system comprised of these two variables are always accompanied by a change in the slope of these variables. It is pretty simple, yet the application outcome was satisfactory. The strength of the slope-measure is that because it is sensitive to the change in both the amplitude and latency, this measure makes it possible to focus on one marker during surgery with good performance in the detection of significant change at the same time. Considering the fact that the main aim of IOM during surgery is to reduce the risk of loss of function before being permanently damaged8,12,15), early detection of significant change in neural responses to external stimulation is an important requirement for a marker used in IOM. In that sense, the slope-measure meets the requirement for convenience as a marker for intraoperative SEP monitoring.
SEP monitoring during cerebral aneurysm clipping
It is well-known that SEP changes may reflect intraoperative cerebral ischemia2,5,9,11,12,13,16,17,19,21,23). However, when temporary clipping is applied during intracranial aneurysm surgery, it increases the risk of ischemia. Thus, the practice of SEP monitoring is supported in order to track the changes in SEP from cerebral ischemia. In fact, the early detection of an ischemic event directs attention to the need for measures such as withdrawal of temporary clipping or identification of another factor to reduce the risk of post-operative deficit17). In that sense, our new measure can help a technician pay attention to an adverse event from temporary clipping as soon as possible.
Slope-measure of the single trials
There is no doubt about the usefulness of intraoperative SEP monitoring during surgery, but one intrinsic problem regarded as the main technical obstacle to being a more useful and instant monitoring technique in practice is the low signal-to-noise ratio (SNR). The SNR is a major difficulty in obtaining a true SEP from recordings3,6). The averaging technique has been widely accepted to overcome this difficulty and produce a time-locked signal. There are variations, but in most cases, hundreds of trials are averaged to obtain a true SEP. It means that for an instance, the acquisition time for an SEP is at best 100/2.9 Hz=34.5 s at our SEP acquisition setting for a stimulus frequency of 2.9 Hz and 100 sweeps. Unlike the MEP technique, the main disadvantage of SEP is that it takes some time to get the responses. To overcome this disadvantage, various approaches have been introduced, focusing on the reduction of the number of trials. These previous studies used many techniques including parametric decomposition1), Bayesian analysis22), digital filters4), and a patient-specific Gaussian template6). According to a recent study6), a patient-specific Gaussian template can be used to detect the SEP using only 30 trials, resulting in a considerable reduction in the acquisition time benefiting SEP monitoring. Hu et al.7) reported the feasibility of time-frequency analysis of SEP for intraoperative spinal cord monitoring.
In the present study, we found that the application of the slope-measure to single trials is a useful tool for intraoperative SEP monitoring. Prior to applying the slope-measure to single trials, the single trial was passed through optimal filters. In addition to the optimal filters, we accepted the detection time only when a 30% decrease in the slope-measure persisted for at least 3 seconds because a decrease in the slope-measure for too short a time would be a transitory change that might not be a real sign of possible damage to the neural system. Through this procedure, the possibility of using the slope-measure of single trials as a marker for intraoperative SEP monitoring was confirmed.
Methodological consideration and implications for further studies
According to our results, the quality of the detection performance of the slope-measure of the EP and single trials was better than or equal to that of the conventional method. However, especially in the case of applying the measure to single trials, this performance quality may depend on the filters applied. Thus, optimal filters should be selected. Although the post-hoc notch and moving average filters seemed to be optimal in the present study, there may be other filters that could be used. Further studies in this regard will follow. The application of the slope-measure to the various types of surgery would require further verification of the usefulness of the measure. However, we presume that the slope-measure for intraoperative SEP monitoring will work nicely regardless of the types of surgery because the nature of the slope-measure reflecting the change in the amplitude and latency is invariant.
In the present study, we compared the significant change detection time, i.e., the detection performance of the slope-measure with the conventional method. Therefore, the clinical correlation with the postoperative neurological deficit should be evaluated more precisely in a future study. The 30% decrease to the baseline value was accepted as a significant EP change, but a sensible warning criterion based on the receiver operating characteristic curve analysis, a graph of sensitivity and specificity will provide a more exact threshold of the significant EP change criterion.
CONCLUSION
The slope-measure defined by the relative slope of the amplitude and latency to the baseline is a useful tool for the detection of significant intraoperative SEP changes during MCA clipping surgery. Through a retrospective data analysis, we validated the feasibility of this measure and showed that its performance quality was better than or equal to the conventional method in both EP and single trials applications. This measure is simple to calculate but provides very useful information for IOM.
Acknowledgements
This research was supported by Ministry of Knowledge and Economy (MKE) through Standard Reference Data Program (Grant no. 10044282).