Radiological Significance of Ligamentum Flavum Hypertrophy in the Occurrence of Redundant Nerve Roots of Central Lumbar Spinal Stenosis
Article information
Abstract
Objective
There were previous reports of redundant nerve roots (RNRs) focused on their clinical significance and pathogenesis. In this study, we investigated the significant radiologic findings that correlate with RNRs occurrence. These relations would provide an advanced clue for clinical significance and pathogenesis of RNRs.
Methods
Retrospective research was performed with data from 126 patients who underwent surgery for central lumbar spinal stenosis (LSS). Finally, 106 patients with common denominators (inter-observer accuracy : 84%) were included on this study. We divided the patients into two groups by MRI, patients with RNRs and those with no RNRs (NRNRs). Comparative analyses were performed with clinical and radiologic parameters.
Results
RNRs were found in 45 patients (42%) with central LSS. There were no statistically significant differences between the two groups in severity of symptoms. On the other hand, we found statistically significant differences in duration of symptom and number of level included (p<0.05). In the maximal stenotic level, ligamentum flavum (LF) thickness, LF cross-sectional area (CSA), dural sac CSA, and segmental angulation are significantly different in RNRs group compared to NRNRs group (p<0.05).
Conclusion
RNRs patients showed clinically longer duration of symptoms and multiple levels included. We also confirmed that wide segmental angulation and LF hypertrophy play a major role of the development of RNRs in central LSS. Together, our results suggest that wide motion in long period contribute to LF hypertrophy, and it might be the key factor of RNRs formation in central LSS.
INTRODUCTION
Redundant nerve roots (RNRs) of the cauda equine were first reported by Verbiest20) in 1954 and named by Cressman and Pawl1) in 1968. Although many reports of RNRs have been published since then, the mechanism of RNRs is still unclear. It is described by a tortuosity of elongated and enlarged nerve roots in the subarachnoid space of the lumbar spine18) and a possible causal relationship between RNRs and central lumbar spinal stenosis (LSS) was recently suggested13).
There were several studies that have focused on the clinical significance of RNRs and its pathogenesis3,5,6,8,13-15,18,19). Suzuki et al.18) suggested that advanced age, longer duration of symptoms, and more severe neurological signs and symptoms were significant factors for patients with RNRs while Min et al.6) showed different results that only advanced age had statistically significance relationship with the above parameters. The anatomic based static pathogenesis of RNRs of the cauda equine has been attributed to a mechanical trapping at the constricted spinal canal acting on the nerve roots and squeezing force at the most stenotic level18), but the dynamic mechanism of roots trapping in central LSS has not been investigated yet. In this study, we evaluated the correlation between RNRs and dynamic anatomical characteristics of central LSS to find out the clinical and radiologic evidence in the development of RNRs of cauda equine.
MATERIALS AND METHODS
We conducted retrospective research with data from 126 patients who underwent decompressive surgery for central LSS in our institute from January, 2007 to December, 2010. Exclusion criteria was revision, lack of radiologic data, low quality of MRI, infection, compression fracture on same level of central LSS, prominent ruptured disc, and exclusive foraminal stenosis. Three neurosurgeons divided the patients into two groups. Group I included patients with RNRs of cauda equine, and group II included patients with non-RNRs (NRNRs). RNRs were defined as tortuosity of elongated and coiled nerve roots in the subarachnoid space associated with spinal stenosis, demonstrable by sagittal T2 weighted MRI (Fig. 1). Finally, 106 patients (inter-observer accuracy : 84%) who showed common denominators were included on this study. Comparative analyses were performed on clinical and radiologic parameters.
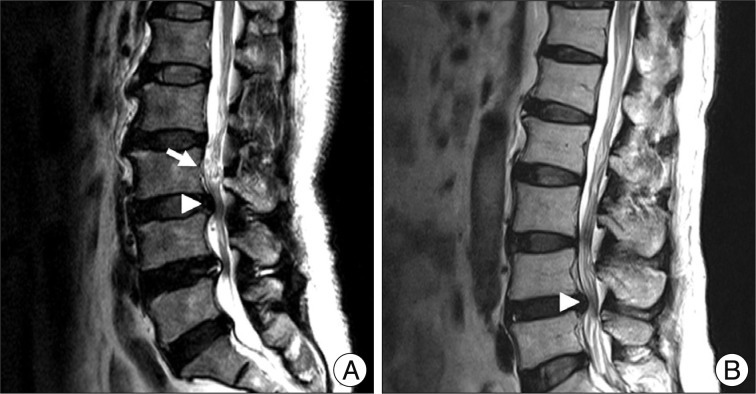
Demonstration of RNRs (A) and NRNRs (B). Arrow head indicates the maximal stenotic lesion and arrow indicates RNRs.
On clinical parameters, we analyzed age, sex, duration of symptoms, severity of symptoms (pre-op visual analogue scale (VAS), back pain/lower extremities pain and Oswestry disability index (ODI) (Table 1) score, and level included. Because symptomatic central LSS has been originated from the maximal stenotic level11), we measured dural sac cross-sectional area (CSA), intervertebral disc (IVD) CSA, fat CSA, thickness of ligamentum flavum (LF), and area of LF within bony spinal canal, at the maximal stenotic level using magnetic resonance (MR) images and Image J 1.44 NIH software (Fig. 2). Segmental angulation was also measured to quantify mechanical instability at the involved lesion by dynamic plain lateral radiograph (Fig. 3).
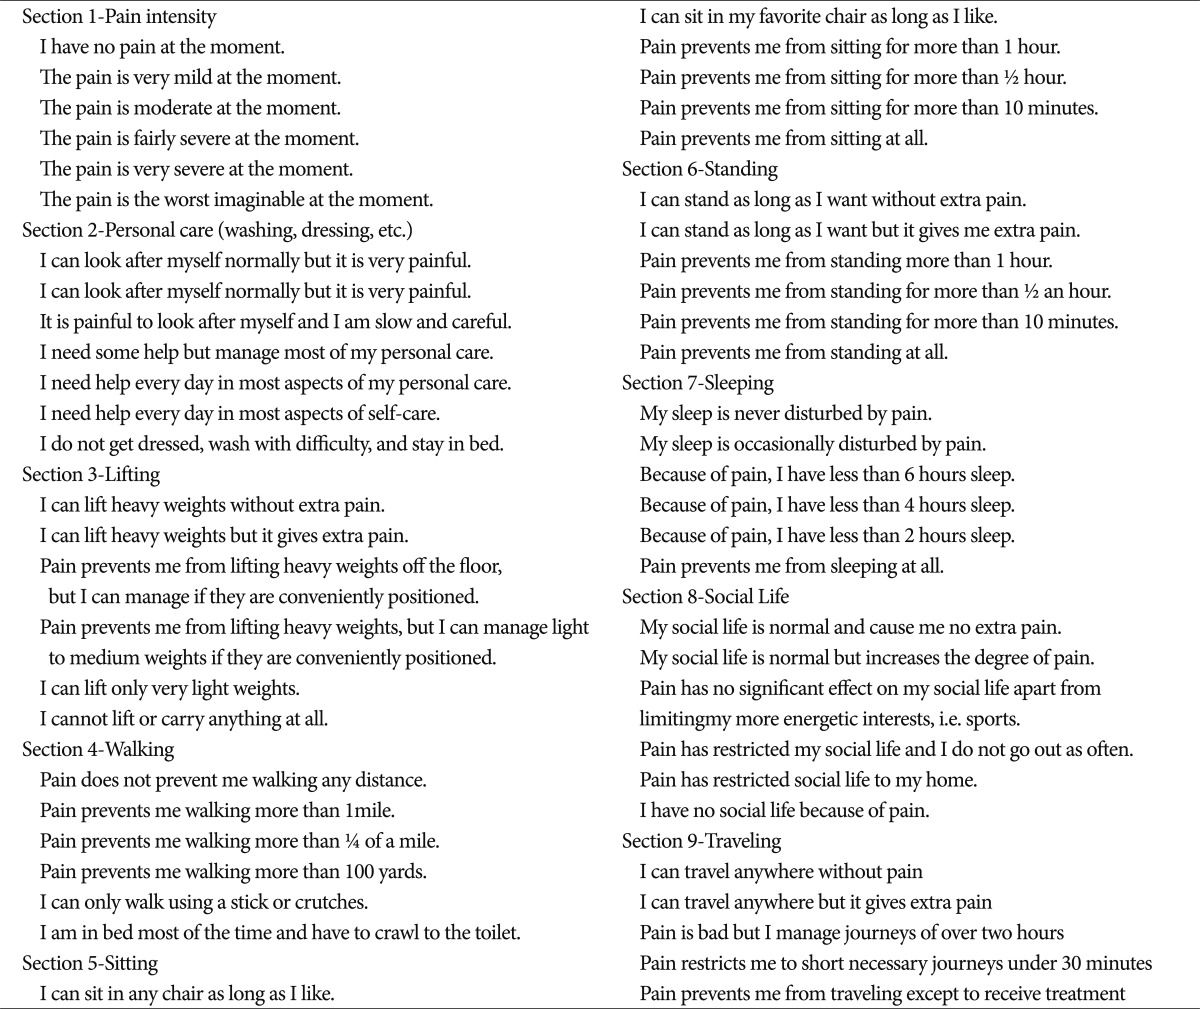
Oswestry disability index
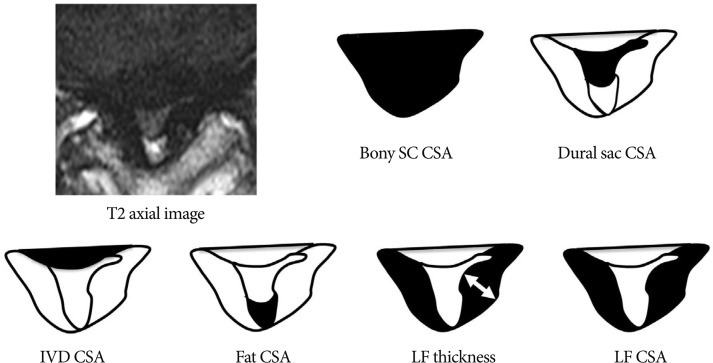
Measuring anatomical structures within the maximal stenotic level using T2-weighted axial magnetic resonance (MR) image. We measured bony spinal canal (SC) cross-sectional area (CSA), dural sac CSA, intervertebral disc (IVD) CSA, fat CSA, ligamentum flavum (LF) thickness, and LF CSA within spinal canal, and calculated these parameters using Image J 1.44 NIH software.
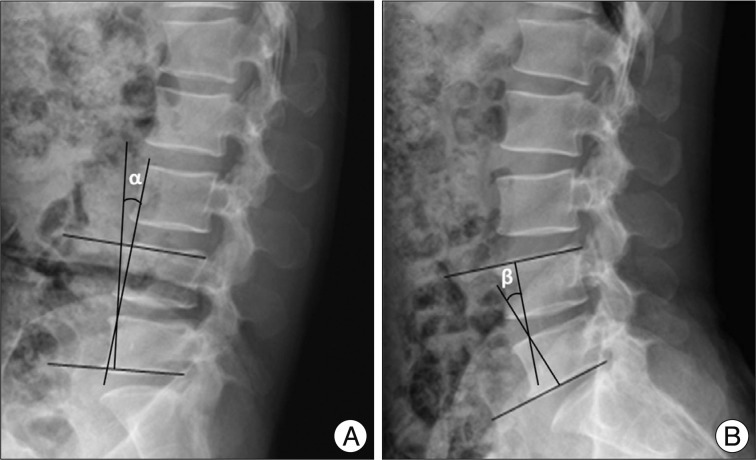
Method of measurement of segmental angulation by dynamic pain lateral radiograph. We measured as the difference of intervertebral angles from flexion (α in A) to extension (β in B) using lower end plate of inferior body and upper endplate of superior body.
Unpaired Student's t-test was used to test the data. The level of significance was set at a probability value of less than 0.05.
RESULTS
Clinical manifestation in RNRs and NRNRs groups (Table 2)

Demographic characteristics and clinical manifestation of both groups
RNRs were found in 45 patients (42%) with central LSS. Between the RNRs and NRNRs groups, the mean ages were similar (RNRs : 66.38±9.02 years vs NRNRs : 65.16±9.02 years, p=0.495) and sex proportions also showed no statistic difference (RNRs : m : f=1 : 1.5 vs. NRNRs : m : f=1 : 1.1, p=0.553). There were no statistically significant differences between the two groups in severity of symptoms : pre-op VAS back pain (RNRs : 6.17±2.90 vs. NRNRs : 5.06±3.09, p=0.205), pre-op VAS lower extremities (RNRs : 7.50±2.62 vs. NRNRs : 5.83±3.22, p=0.063), and ODI score (RNRs : 23.72±11.22 vs. NRNRs : 20.26±10.10, p=0.260). On the other hand, we found statistically significant differences in duration of symptoms (RNRs : 37.07±58.62 months vs. NRNRs : 19.20±30.93 months, p=0.045), and the number of level included (RNRs : 1.69±0.76 vs. NRNRs : 1.20±0.44, p=0.000). The disc space between 4 and 5 lumbar spine was major portion of spinal stenosis in both.
The difference of radiologic parameters in RNRs and NRNRs group (Table 3)
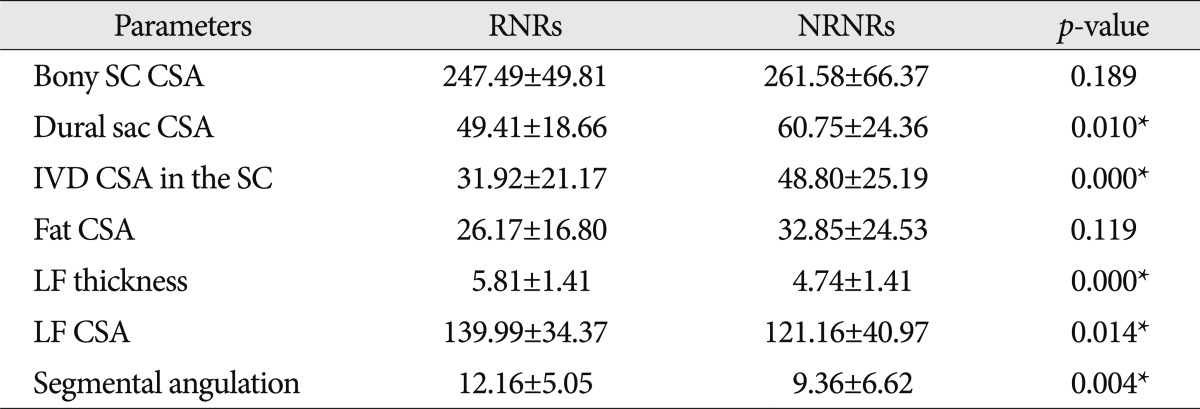
The anatomical differences in the maximal stenotic level of both groups
In MR images, the maximal stenotic level was frequently developed at the L4-5 and L3-4 region in both groups (RNRs : 40 cases, 89%; NRNRs : 56 cases, 92%) (Table 2). At the maximal stenoic level, the CSA of bony spinal canal (RNRs : 247.49±49.81 mm2 vs. NRNRs : 263.58±69.37 mm2, p=0.189) (Fig. 4A) and fat CSA (RNRs : 26.17±16.80 mm2 vs. NRNRs : 32.85±24.53 mm2, p=0.119) (Fig. 4D) had no significantly different between the two groups. However, dural sac CSA (RNRs : 49.41±18.66 mm2 vs. NRNRs : 60.77±24.36 mm2, p=0.010) (Fig. 4B), thickness of LF (RNRs : 5.81±1.41 mm vs. NRNRs : 4.74±1.41 mm, p=0.000) (Fig. 4E), LF CSA within spinal canal (RNRs : 139.99±34.37 mm2 vs. NRNRs : 121.16±40.97 mm2, p=0.014) (Fig. 4F), and segmental angulation (RNRs : 12.16±5.05 degree vs. NRNRs : 9.36±6.62 degree, p=0.004) (Fig. 5) showed statistically significant differences between the two groups. IVD CSA within spinal canal (Fig. 4C) is significantly larger in NRNRs group (47.82±24.38 mm2) than RNRs group (31.92±20.93 mm2).
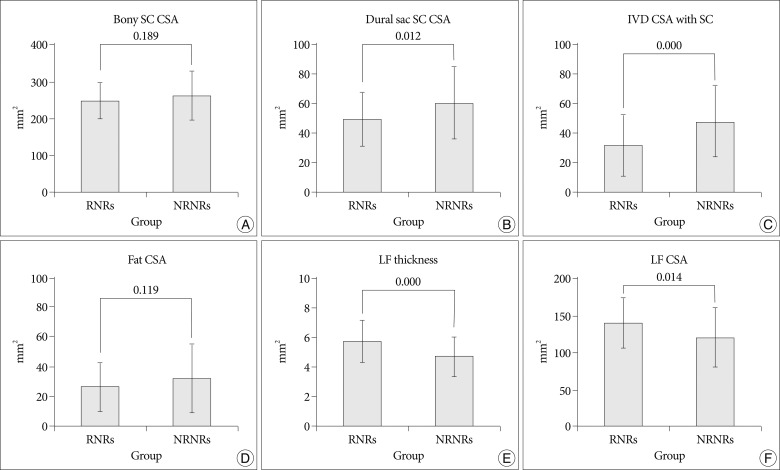
Radiologic differences of anatomical structures within spinal canal (SC) between RNRs group and NRNRs group. At the maximal stenoic level, the CSA of bony SC (A) and fat CSA (D) had no significantly difference between the two groups. However, dural sac CSA (B), LF thickness (E), LF CSA (F) shows statistically significant differences between the two groups. IVD CSA within SC (C) is significantly larger in NRNRs group than RNRs group (significant p-value <0.05). Mean values are presented±standard deviations (SDs).
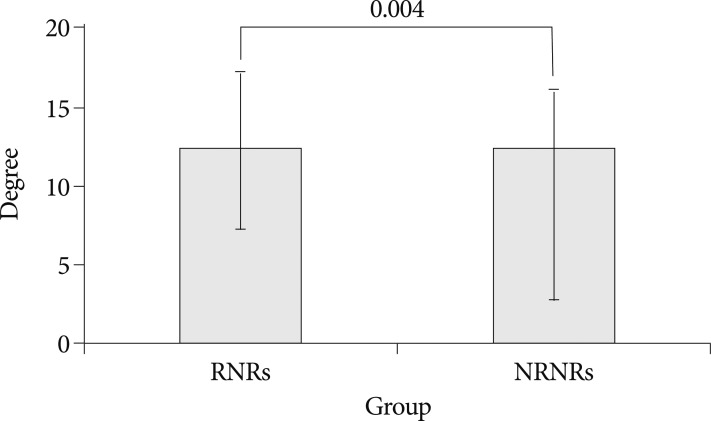
Segmental angulation at maximal stenotic level. Segmental angulation shows statistically significant differences between the two groups (p-value=0.004). Mean values are presented±standard deviations (SDs).
DISCUSSION
We demonstrate that RNRs of cauda equine are not radiologically rare findings (42%) in central LSS patients, and the incidence of RNRs is consistent with the studies of Suzuki et al.18) (42.3%). Many researchers tried to figure out clinical significance of RNRs, but it remained unclear. Among clinical parameters, our results showed that longer duration of symptoms is a statistically significant factor, while clinical manifestation including VAS and ODI score are not significantly different between two groups. A previous report suggested that patients with RNRs had advanced ages, longer durations of symptoms, and more severe neurological signs and symptoms18) while another report proposed only advanced age as a significant parameter6). Considering the results together, we suggest that clinical correlation with RNRs still remain a controversy although there are radiologic differences between two groups.
Most of previous studies included only one level spinal stenosis, which is the most stenotic level. Yukawa et al.21) found that the patients with two or more stenotic levels walked for a significantly shorter distance preoperatively and postoperatively than patients with stenosis at only one level. In this study, RNRs patients showed more multiple level central LSS although the most stenotic lesion closely related to development of RNRs. Therefore, our study results imply a meaningful relationship between neurogenic intermittent claudication and RNRs. We also confirmed that wide segmental angulation plays a major role in the development of RNRs in central LSS, identifying that L4-5 level are the most movable segments. These results indicate multiple stenosis and wide angular movement could be one of the important factors for RNRs formation in central LSS.
In symptomatic LSS, encroachment of the cauda equine with its nerve roots is the primary cause of the symptom and signs and preoperative symptoms were related to the single most constricted level of the cauda equine, minimum CSA11). In this study, the bony spinal canal CSA had no difference between the two groups although this structure could be changed in central LSS compared to normal spinal canal. Schonstrom et al.17) have reported that the mean CSA of normal dural sac was 178±50 mm2, whereas in patients with degenerative LSS the mean CSA was 89.6±35.1 mm2. In present study the dural sac CSA at the level of the maximal stenosis was significantly smaller in RNRs group than NRNRs groups. These results suggest that the degree of constriction in the cauda equine can be the predictive factor of RNRs development. We also measured IVD CSA within spinal canal because IVD can be compressive structure to the dural sac. We found that IVD is not related to development of RNRs. Usually IVD protrusion evoked immediate severe low back pain or radiculopathy. Therefore, we considered that IVD protrusion might not be related to continuous squeezing force at stenoic level for long duration, which is major pathomechanis of RNRs development.
In this study, our major focus was to find out most distributing factor for RNRs formation among the spinal canal structure. We observed strong positive connection between LF hypertrophy and RNRs occurrence in central LSS. Using MR axial images at the maximal stenotic level, measuring the thickness and CSA of LF provide more quantitative information about LH hypertrophy than thickness measurement alone. In this study, we confirmed that the occurrence of RNRs in central LSS show stronger association with LF hypertrophy than the other structure in the spinal canal. Multiple studies supported that LF hypertrophy is a major pathogenic factor of central LSS4,12,22), and that LF hypertrophy has close relationship with mechanical stress2,7,9,10,16). Furthermore, repetitive (longer duration) wide motion (wide segmental angulation) in maximal stenotic level could be considered as high mechanical stress that may lead to development of LF hypertrophy7). Together, the results suggest that even though there are several factors that may be related to the development of central LSS, LF hypertrophy could be the major anatomical causes of RNRs formation in central LSS patients.
CONCLUSION
In conclusion, we demonstrated that RNRs of cauda equine are radiologically common findings in central LSS patients. Although there is no significant difference of clinical manifestation besides symptom duration and included level number between RNRs and NRNRs groups, we confirmed that wide segmental angulation and LF hypertrophy play a major role of the development of RNRs in central LSS. This study also provides a clue of pathogenesis of RNRs of cauda equine, implicating that investigation of the mechanism of LF hypertrophy would be important for future therapeutic approach of central LSS with RNRs.
Acknowledgements
This research was supported by the Basic Science Research Program of the National Research Foundation of Korea (NRF), funded by the Ministry of Education, Science and Technology (2011-0021292).