Trends in Incidence and Treatment of Herniated Lumbar Disc in Republic of Korea : A Nationwide Database Study
Article information

Abstract
Objective
This study aimed to determine the incidence and analyze trends of the herniated lumbar disc (HLD) based on a national database in the Republic of Korea (ROK) from January 2008 to December 2016.
Methods
This study was a retrospective analysis of data obtained from the national health-claim database provided by the National Health Insurance Service for 2008–2016 using the International Classification of Diseases. The crude incidence and age-standardized incidence of HLD were calculated, and additional analysis was conducted according to age and sex. Changes in trends in treatment methods and some treatments were analyzed using the Korean Classification of Diseases procedure codes.
Results
The number of patients diagnosed with HLD was 472245 in 2008 and increased to 537577 in 2012; however, it decreased to 478697 in 2016. The pattern of crude incidence and the standardized incidence were also similar. Overall, the incidence of HLD increased annually for the 30s, 40s, 50s, and 70s until 2012 and then decreased. However, the incidence of HLD for the 80s continued to increase. The crude incidence of HLD in female patients exceeded that of male patients in their middle age (30s or 40s) and was 1.5–1.6 times higher than in male patients in their 60s. The total number of open discectomy (OD) increased from 71598 in 2008 to 93942 in 2012 and then decreased to 85846 in 2016. The rate of younger patients (the 20s, 30s, and 40s) who underwent OD was decreased, and the rate of younger patients who underwent percutaneous endoscopic lumbar discectomy was increased. However, the rate of older patients (the 70s and 80s) who underwent OD was continuously increased.
Conclusion
This nationwide data on HLD from 2008 to 2016 in the ROK demonstrated that the crude incidence and the standardized incidence increased until 2012 and then decreased. The annual crude incidence was different according to age and sex. These findings may be considered when deciding future health policy, especially in countries with a similar national health insurance system (or with plans to adopt).
INTRODUCTION
Surgical treatment is recommended for cases of symptomatic herniated lumbar disc (HLD) that are intractable to nonsurgical treatment [12,39,44]. In recent years, the number of spinal surgeries for HLD performed each year has increased [6]. Open discectomy (OD) is the standard among several surgical methods used, and percutaneous endoscopic lumbar discectomy (PELD), laminectomy, and fusion surgery are other options [12,15,18,40,44-47]. The selection of the surgical method can largely depend on clinical and radiological factors. With the development of new surgical instruments and techniques, the number of spine surgeries has increased [6,28].
Despite the vast amount of research devoted to spinal diseases, the epidemiology of this condition is not well understood, and the overall prevalence is unclear in many countries, even in the United States [10,35]. The Republic of Korea (ROK) has a National Health Insurance Service (NHIS), a compulsory social insurance system that ensures about 97% of the population [15,17,18,36]. The remaining 3% of the population is ensured by medial aid [15,17,18,36]. In ROK, there is a reimbursement system. All hospitals and clinics submit the medical record to Health Insurance Review & Assessment Service (HIRA), including diagnostic and surgical codes, for review to be reimbursed for any healthcare services provided [36]. The HIRA database nationally representative and contains data on multiple variables important to epidemiological research, such as diagnosis, treatment, procedures performed, surgical history, and treatment prescriptions, thereby enabling population-based studies [15,17,18].
The goals of this study were to describe the incidence of HLD and analyze trends of treatment for HLD based on a national database in the ROK using NHIS data from January 2005 to December 2016.
MATERIALS AND METHODS
Data source and cohort design
This type of study did not require informed consent and was exempted from the Institutional Review Board of Seoul National University Bundang Hospital (X-1703-388-909). We used data from the national health-claim database provided by the NHIS for 2005–2016. Using the 10th edition of the International Classification of Diseases (ICD-10) codes, we collected data of patients with HLD. Patients that had been diagnosed with HLD during the preceding three years at any clinic or hospital were excluded from selected incident cases, which were different from prevalent cases. To secure a 3-year washout period, we used 2008 as the index year; thus, the total observation period of the reconstructed cohort was 9 years (2008–2016). Patients must have been diagnosed for the first between January 2008 and December 2016. We extracted only data from tertiary-referral general hospitals (3rd Hs, ≥300 beds), general hospitals (100–300 beds), hospitals (Hs, 30–100 beds), and clinics (<30 beds) to increase confidence in medical information [15-19]. We excluded other medical institutions where medical information was not clear. Nearly all hospitals in ROK comply with the following standards of the NHIS for reimbursement: intractable painful sciatica from a disc herniation despite nonsurgical treatment for at least 6 weeks if HLD is not accompanied by neurological deficits [15,18]. However, the selection of the surgical method was at the discretion of the surgeon [15,18].
Study population
We identified patients with HLD in each year using according to the following ICD-10 codes (Table 1). Patients with these disease codes as the main diagnosis were included in this study. Patients with these disease code as an accessory diagnosis were excluded. Patients with a congenital anomaly or a history of trauma were also excluded. Regarding patients diagnosed with HLD, this study included only patients for whom the use of diagnostic modalities such as computed tomography, or magnetic resonance image within 4 weeks from the initial diagnosis was reported. The information for the population and the number of hospital of ROK was obtained from an open data access system (Korean Statistical Information Service; www.kosis.kr) [23].

Definition of HLD
Data analysis
The number and distribution of patients with HLD stratified by age, and sex
The annual crude incidence was calculated for HLD instead of overall crude incidence because the incidence of HLD changed annually. First, the number of cases of HLD, diagnosed for the first time from 2008 to 2016, was obtained. Then, the annual crude incidence of HLD was calculated using the total population of each year, which had been corrected for the number of deaths and births in each year.
Also, the annual crude incidence of HLD according to age and sex were also obtained. The standardized incidence of HLD was derived from the crude incidence using the formula below, after adjusting for demographic bias in this cohort relative to the national population structure. (Pi = proportion of each age / sex group of the national population; Ii = incidence of each age / sex group of the cohort population).
Also, the age-specific incidence was calculated to obtain the crude incidence for each age group, with the age-groups being defined in 10-year periods. We performed data manipulation and extraction using SAS version 9.4 (SAS Institute, Cary, NC, USA).
Treatment for HLD
Change in the trend of treatment method and number of treatments was analyzed for HLD, and change in some treatments by region and hospital size were also analyzed. Treatments for HLD consisted of OD, defined using procedure codes H3585 and H4055 in the Korean Classification of Diseases procedure codes, and PELD defined using codes H4282. The departments that performed the surgery were also classified according to the code, defined 05 for the department of orthopedic surgery and 06 for the department of neurosurgery.
Statistical analysis
The statistical analysis was conducted to analyze the annual trends in the number of HLD, including the differences in age, and sex. Spearman’s rank-order correlation was used to determine the linear relationship of a trend with Spearman’s coefficient (r) and p-value. The Wilcoxon signed rank test was used to confirm the change in the variables each year. A p-value <0.05 was regarded as statistically significant (two-tailed). Statistics were performed using SPSS version 22 (IBM Corp., Armonk, NY, USA).
RESULTS
The number and distribution of patients with HLD stratified by age, and sex
The number of patients diagnosed with HLD was 472245 in 2008 and increased to 537577 in 2012; however, it decreased to 478697 in 2016 (Fig. 1). The pattern of crude incidence and the standardized incidence were also similar. The crude incidence of HLD increased from 946.8 to 1053.3 per 100000 personyear until 2012 and then decreased to 918.2 per 100000 person-year in 2016 by an average of 3% each year (p<0.01; r=1.0). The standardized incidence of HLD increased from 946.8 to 975.1 per 100000 person-year until 2012 and then decreased to 796.1 per 100000 person-year in 2016 by an average of 4.5% each year (p<0.01; r=1.0).
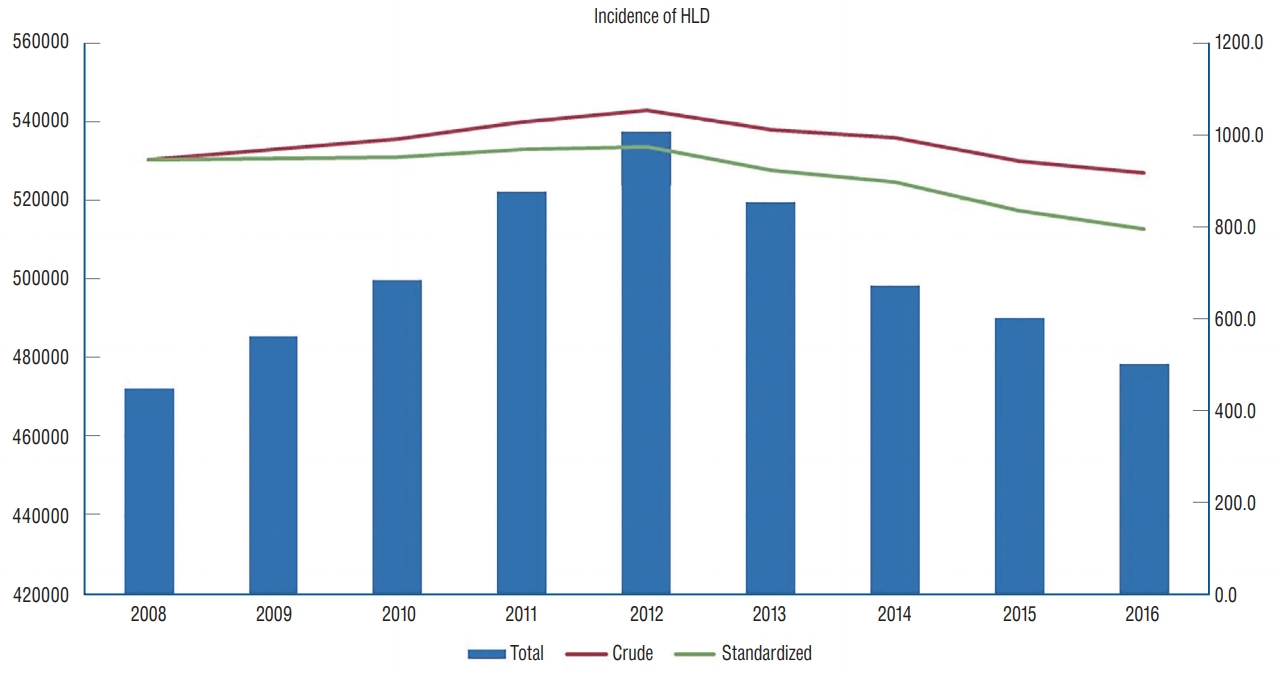
The total incidence, crude incidence and standardized incidence of HLD from 2008 until 2016. HLD : herniated lumbar disc.
Overall, the incidence of HLD increased annually for the 30s, 40s, 50s, and 70s until 2012 and then decreased (Fig. 2A). However, the incidence of HLD for the 80s continued to increase. The age-specific incidence for patients older than 40 years exceeded the overall crude incidence (Fig. 2B). The rate of diagnosis for HLD older than 60 years was increased from 36.0% in 2008 to 41.6% in 2016. The percentage of diagnosis of HLD according to age decreased in the 40s or less, and it increased in the 70s or more (Table 2).
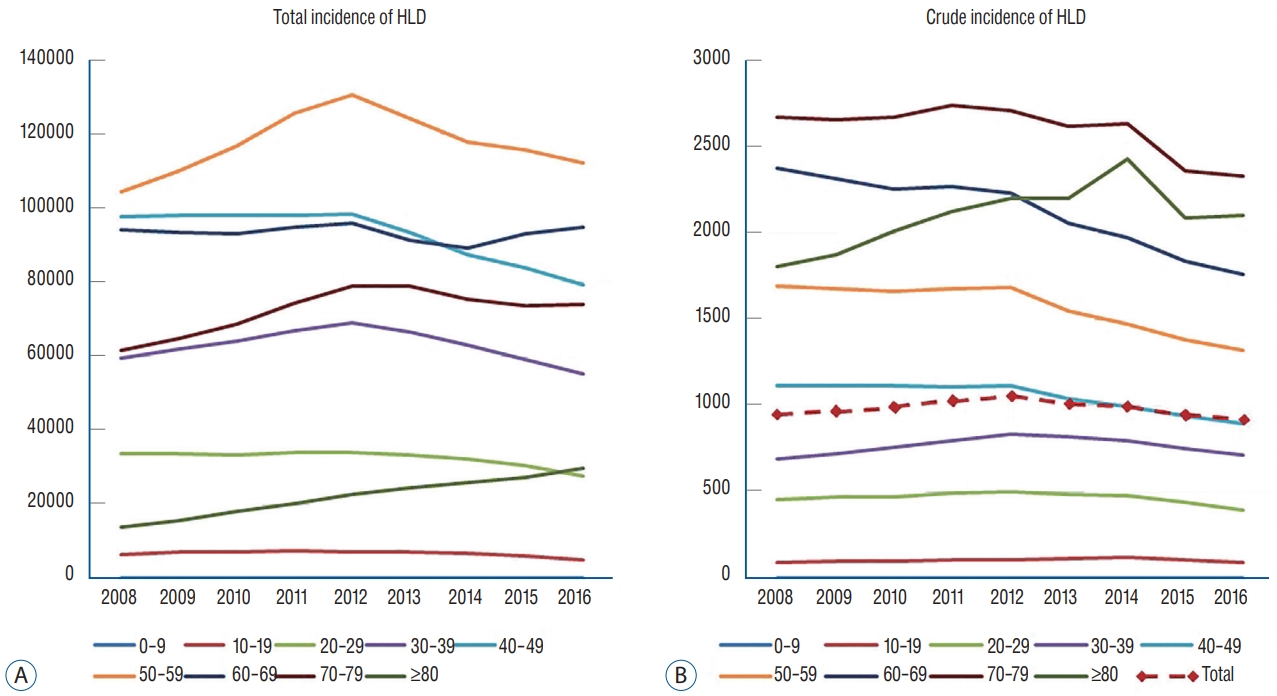
A : The total incidence of HLD for each age group diagnosed with HLD from 2008 until 2016. B : The crude incidence of HLD for each age group diagnosed with HLD. HLD : herniated lumbar disc.
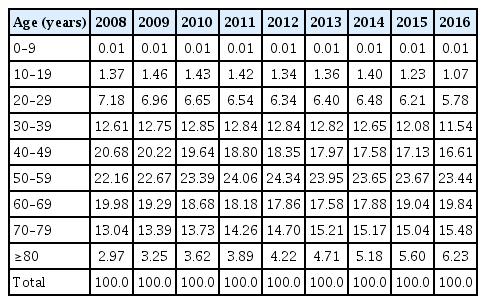
The percentage for each age group diagnosed with HLD from 2008 until 2016
Regarding the crude incidence according to sex in 2008, the crude incidence of HLD in female patients exceeded that of male patients in their 30s and was 1.6 times higher than in male patients in their 60s (Fig. 3A). In 2016, however, the crude incidence of HLD in female patients exceeded that of male patients in their 40s and was 1.5 times higher than in male patients in their 60s (Fig. 3B).

A : The crude incidence of HLD according to sex in 2008. B : The crude incidence of HLD according to sex in 2016. HLD : herniated lumbar disc.
Treatment for HLD
The total number of OD increased from 71598 in 2008 to 93942 in 2012 and then decreased to 85846 in 2016 (Fig. 4A). The OD was the most performed at a hospital, followed by a general hospital and tertiary referral hospital. In 2008, 85.3% (61056/71598) of OD was performed at medium-sized hospitals (general hospitals and hospitals) and, in 2016, 85.3% (61056/71598) of OD was performed at medium-sized hospitals. The number of OD showed a different pattern according to the age group (Fig. 4B). The number of younger patients (the 30s and 40s) who underwent OD were decreased from 2010, and that of older patients (the 60s, 70s, and 80s) who underwent OD were continuously increased. The rate of OD also showed a different pattern according to the age group (Table 3). The percentage of younger patients (the 20s, 30s, and 40s) were continuously decreased, but that of older patients (the 70s and 80s) was continuously increased.

A : The total number of OD from 2008 until 2016. B : The number of OD according to the age group. OD : open discectomy.
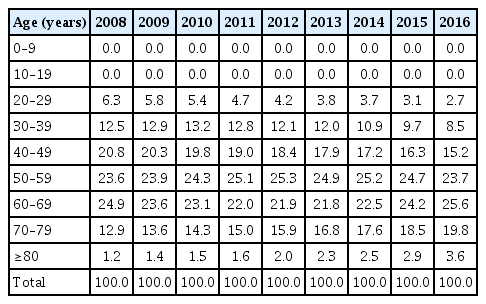
The percentage of each age group who underwent open discectomy for HLD from 2008 until 2016
The total number of PELD decreased from 1990 in 2008 to 1142 in 2013 and then increased to 2131 in 2016 (Fig. 5A). The PELD was also the most performed at a hospital, followed by a general hospital and tertiary referral hospital except 2012. In 2008, 91.8% (1827/1990) of PELD were performed at mediumsized hospitals (general hospitals and hospitals) and, in 2016, 94.0% (2003/2131) of PELD were performed at medium-sized hospitals. The number of PELD showed a different pattern according to the age group (Fig. 5B). The number of younger patients (the 20s, 30s, and 40s) who underwent PELD was much higher than that of older patients (the 60s, 70s, and 80s) who underwent PELD.

A : The total number of PELD from 2008 until 2016. B : The number of PELD according to the age group. PELD : percutaneous endoscopic lumbar discectomy.
From 2008 to 2016, the cost and the annual number of operation of OD and PELD increased (Table 4). OD was more expensive, and the proportion of OD in total HLD surgery had increased. Therefore, the total cost increased significantly.
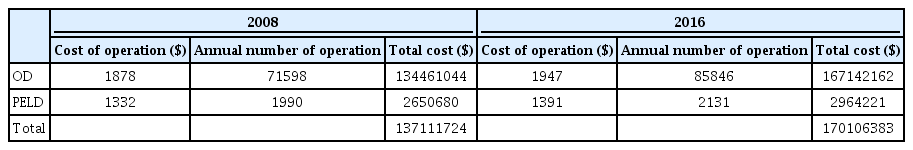
The total cost of the HLD in 2008 and 2016
We analyzed the differences between neurosurgeons and orthopedic surgeons in the choice of surgical method (Table 5). The number of OD by neurosurgeon was increased from 54535 in 2008 to 66383 in 2016, and that of PELD by neurosurgeon was also increased from 1414 in 2008 to 1872 in 2016. The ratio of OD to PELD by neurosurgeon was similar. The number of OD by the orthopedic surgeon was increased from 19279 in 2008 to 19680 in 2016. However, that of PELD by the orthopedic surgeon was decreased from 580 in 2008 to 303 in 2016.
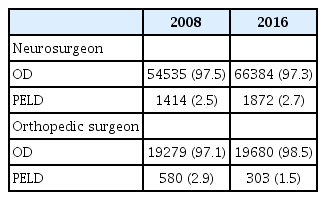
Choice of a surgical method according to surgeon specialty
DISCUSSION
This study analyzed a comprehensive overview of the incidence and treatment of HLD in ROK based on NHIS database. The strength of the current study is that it analyzed nationwide data from a single-ethnicity population of 50 million people to evaluate trends in the incidence and treatment of HLD. Therefore, this study is sufficiently reliable. In the previous study, the surgeries for HLD and cost-effectiveness have been analyzed based on the NHIS database [16]. However, the applicability of these findings is limited because only data from 2003 to 2008 were included.
The number of patients diagnosed with HLD was increased until 2012; however, it decreased until 2016. The pattern of crude incidence and the standardized incidence were also similar. The surgical indications for HLD guided by NHIS and HIRA were similar for 9 years, and the benefit standards also did not change. However, since the early 2000s, media have raised questions about overdiagnosis and unnecessary treatment of spinal diseases. Especially in 2013, many media have pointed this out and become social issues. Since then, the number of patients seeking a hospital for spinal disorders has decreased. Furthermore, as the standards for the reimbursement of diagnosis and treatment become stricter, non-deductible treatment (e.g., neuroplasty, neurolysis) and Korean Traditional Medicine (KTM; traditional oriental medicine adopted in Korea) practice have increased. The proportions of KTM hospitals increased from 30.2% (12890/42682) in 2012 to 32.6% (15093/46297) in 2016. Unfortunately, it is impossible to obtain accurate statistics on these non-deductible treatments and KTM practice through the NHIS data.
The incidence of HLD for the 80s continued to increase. The age-specific incidence for patients older than 40 years exceeded the overall crude incidence. The rate of diagnosis for HLD older than 60 years was increased from 36.0% in 2008 to 41.6% in 2016. The rate of diagnosis of HLD according to age decreased in the 40s or less, and it increased in the 70s or more. The increase in the number of seniors is due to the increase in the elderly population in ROK. The proportion of the old age group over than 65 years old increased from 11.3% (5424667/47990761) in 2010 to 13.3% (3079213/51269554) in 2016 continuously as Korean society is aging (Korean Statistical Information Service; www.kosis.kr).
In general, men have roughly twice the risk for lumbar herniated discs compared with women [7,14]. In a previous nationwide cohort study, the proportion of male patients who had undergone surgery for HLD was 60.1% and 59.2% in 2003 and 2008, respectively. However, in this study, the crude incidence of HLD in female patients exceeded that of male patients in their middle age (30s or 40s) and was 1.5–1.6 times higher than in male patients in their 60s. With improvements in advanced imaging techniques, HLD has been increasingly recognized in symptomatic and asymptomatic individuals [2]. Previous work suggests lumbar lordosis, representative of lordotic curvature between L1 and S1, was 7.3° greater in females than males when standing [1]. Additionally, the sacral slope was greater in females than males, when standing. These results support that females have a greater range of motion in the spine. Therefore, women may have more degenerative discs than older men. However, possible explanations for the male predominance of surgically treated HLD could be that men have more symptomatic HLD by gender different risk-taking behavior and gender-specific referral pattern by profession [42].
The total number of OD increased from 2008 to 2012 and then decreased to 2016. However, the total number of PELD decreased from 2008 to 2013 and then increased to 2016. The OD and the PELD were performed mostly at medium-sized hospitals (hospitals and general hospitals) in 2008 and 2016. Various factors may have contributed to the changed number of surgeries, such as improvements in instrumentation, surgical techniques, the inf luence of key opinion leaders, and financial incentives to hospitals and surgeons [6,8,27,29]. The choice of surgical method can be chosen at the discretion of the surgeon, but it is not free from the control of NHIS [21]. If the standards for the reimbursement of a specific surgical method (e.g., PELD) become stricter, then the number of surgeries with more lenient standards might increase. The balloon effect might explain this phenomenon [26]. This phenomenon might affect medium-sized hospitals. However, biportal endoscopic spine surgery was introduced to manage central and foraminal stenosis with its wide range of access angle and clear view. Thus, the total number of endoscopic discectomy increased again.
The number of OD showed a different pattern according to the age group. The rate of younger patients (the 20s, 30s, and 40s) who underwent OD was continuously decreased, but that of older patients (the 70s and 80s) was continuously increased. The number of younger patients (the 20s, 30s, and 40s) who underwent PELD was much higher than that of older patients (the 60s, 70s, and 80s) who underwent PELD. Although age was not a risk factor for recurrence after OD, recurrence after PELD was reported to be higher in elderly patients (47 vs. 34 years, p≤0.01) [4,5,20,34]. Previous study reported that the patients with recurrence had significantly more severe disc degeneration before operation compared with patients with no recurrence [5]. Also, fragmentation of disc material was expected with the progression of disc degeneration [4]. Moreover, the rapid progress of degeneration has been reported at the index level and adjacent level in older patients [25]. Some studies showed that recurrence rates are lower when removing a large amount of discs than removing only the symptom-causing disc fragment [31,32]. Therefore, it is beneficial for elderly patients to remove a large amount of disk and decompress the spinal canal, considering the remnant loose disc material inside the disc space and further degeneration [30,32,41,48]. Consequently, the advantage of each surgical technique may be counterbalanced at some age. In the previous study, PELD may not be effective for patients older than 57 years [15].
As mentioned above, HIRA data did not include the cost of non-deductible treatment. The real cost of PELD was more expensive than that shown in Table 4 and was similar to the cost of OD. Therefore, the total cost of the HLD operation (including OD and PELD) also would have been higher than that shown in Table 4.
The ratio of OD to PELD by neurosurgeon was similar between 2008 and 2016. However, the ratio of OD to PELD by the orthopedic surgeon was decreased. It has been reported that there was a statistically significant difference between neurosurgeons and orthopedic surgeons in the type of discectomy, the value of intervention after complete spinal cord injury, and the use of orthoses after fusion surgery [13]. However, other studies have demonstrated that surgeons with either training background can achieve similar results and have similar competence when treating common spinal pathologies [22,24,38].
Limitations of the present study
There are several limitations to be addressed in the present study. First, inaccuracies in claims data, such as coding inaccuracies, were a significant limitation of this study. The code system cannot clearly distinguish certain diseases, and there are several codes in some diseases. The ICD-10 code was not developed for use in research. A previous study has questioned the accuracy of administrative data for capturing clinical diagnoses [3]. However, a previous study, which validated the diagnosis of cerebrovascular disease based on ICD-10 codes, comparing Korean claims data with medical record reviews, reported a positive predictive value (PPV) of 83.4% [37]. Additionally, other study validated the diagnosis of cervical spine fracture based on ICD codes, revealing high PPV (94.0%) [33]. Second, this study did not describe the clinical or radiological factors. These factors can affect the probability of surgery and the choice of surgical method. The severity and clinical symptoms cannot be assessed from the claim data [9]. Third, we did not calculate the overall crude incidence for HLD during a sufficient observational period, and thus the understanding of the natural history of each disease is limited. However, the annual crude incidence is considered more appropriate for identifying the trends ref lecting the medical environment. Furthermore, it is thought that there will be limitations in obtaining an accurate crude incidence of HLD, in which the incidence changes rapidly every year, even if a sufficient observational period is considered. Fourth, the recurrence rate and cost of reoperation were not calculated. The rate of recurrent disc herniation was reported from 5% to 15% [11,43]. However, the cost of the reoperation varied depending on the surgical method used for the reoperation. We included only patients who have been diagnosed for the first time during the periods in this study.
CONCLUSION
This nationwide data on HLD from 2008 to 2016 in the ROK demonstrated that the crude incidence and the standardized incidence increased until 2012 and then decreased. The annual crude incidence was different according to age and sex. The trend of treatment methods was also changed and different according to the hospital size and surgeon specialty. These analyses will be of great help in determining future health policies.
Notes
No potential conflict of interest relevant to this article was reported.
Patient consent
This type of study does not require informed consent.
AUTHOR CONTRIBUTIONS
Conceptualization : KJK
Data curation : JMJ, SUL
Formal analysis : JMJ, SUL
Funding acquisition : CWO
Methodology : JMJ, SUL
Project administration : SJH, TAJ, HJK
Visualization : JMJ, SUL
Writing - original draft : JMJ
Writing - review & editing : JMJ, KJK
Acknowledgements
This study was supported by the Policy Research Funds of the Korean Neurosurgical Society.