Change of Pyogenic and Tuberculous Spondylitis between 2007 and 2016 Year : A Nationwide Study
Article information

Abstract
Objective
We attempted to compare the incidence of pyogenic spondylitis (PS) and tuberculous spondylitis (TS) between 2007 and 2016. Furthermore, we investigated the patients who underwent surgery in 2016 compared to that in 2007.
Methods
We used a nationwide database managed by the Korean National Health Insurance Service (NHIS) in 2007 and 2016. Total 9655 patients with a newly diagnosis of PS or TS were enrolled in PS or TS group. Among them, 1721 patients underwent either fusion or decompression surgery. We analyzed demographic distribution of patients according to gender and age and year of diagnosis.
Results
Comparing between 2007 and 2016, the incidence of PS has increased in 2016 than in 2007 (4874 vs. 2431, p<0.0001). Conversely, declination of incidence of TS was discovered in 2016 compared to 2007 (594 vs. 1756, p<0.0001). Females showed predominance over males regarding both PS and TS (5228 vs. 4427, p<0.0001). Among them, the number of PS patients who underwent surgery increased significantly in 2016 relative to that in 2007 (979 vs. 592, p<0.0001).
Conclusion
This nationwide study suggests that PS may increase and TS may decrease in Korea. In addition, demand for surgery regarding PS may increase.
INTRODUCTION
Infectious spondylitis, also known as vertebral osteomyelitis, is an uncommon disease caused by specific microorganisms that affect the vertebral body and intervertebral disc and adjacent perivertebral soft tissue [14]. Etiologies such as Staphylococcus aureus and Mycobacterium tuberculosis are considered to be the causes of pyogenic spondylitis (PS) and tuberculous spondylitis (TS), respectively [2]. In fact, PS accounts for 3–5% of all cases of osteomyelitis and TS represents 1–5% of all tuberculous infections [8,19]. Despite their rarity of incidence, several studies have established epidemiology of PS and TS. However, the studies lack large-scale and long-term data [3,6,11,16,20].
Nationwide studies are less subject to selection biases than case-series studies, thus they have more statistical power [28,30]. Among the two nationwide studies related to the incidence of PS and TS, one study in France found increased incidence of vertebral osteomyelitis during 2002–2003, which involved only a short period [11]. The other recent study done in Japan covered total 7118 patients with vertebral osteomyelitis, but the study also involved short period of 2007–2010 [3].
This present nationwide study aims to investigate the changes in incidence of PS and TS and to investigate the patients who underwent surgery in Korea.
MATERIALS AND METHODS
Data source
Our study was approved by the Institutional Review Boards of Bundang CHA Medical Center (IRB 2017-08-027). The need for informed consent was waived because the data used consisted of deidentified secondary data released for research purposes which subsequently were analyzed anonymously. Data was obtained from the Korean National Health Insurance Service (NHIS) for the year of 2007 and 2016. NHIS has an extensive coverage up to 97% of the population in the Republic of Korea. The remaining 3% represent the lower income class, who are in the Medical Aid program. The NHIS claim database includes extensive information about demographics, medical care and treatments, medical procedures, and various disease diagnoses according to the 10th revised codes of the International Classification of Diseases (ICD-10) [12,17,18,22]. The database is open to any researchers whose study protocols have been approved by an official review committee.
Patient population
Fig. 1 depicts the flow for establishment of the nationwide study. Total 13277 PS or TS patients in the year of 2007 and 2016 were extracted followed by exclusion of 2594 subjects with previous history of PS and TS within 1 year. Then, 145 subjects under age of 20 were excluded. Eight hundred eighty-three subjects who were diagnosed both as PS or TS were excluded, subsequently. Thus, 9655 subjects participated in this study. The number of subjects in PS and TS group were 7305 and 2350, respectively. In addition to the incidence of two types of diseases, demographic data of comorbidities and patients with surgical treatments were evaluated. Surgical treatments were divided into fusion and decompression surgery in our study. Comorbidities were referred by the Charlson Comorbidity Index [26-31].
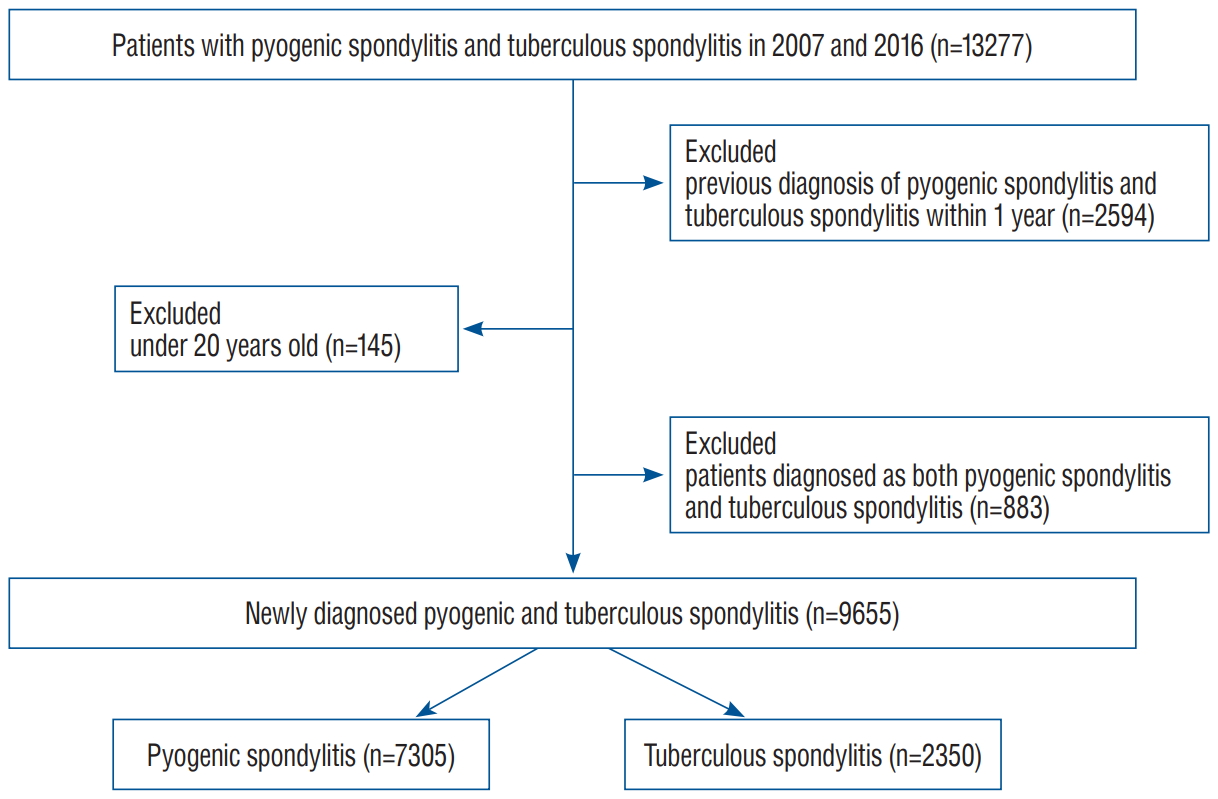
Flow for establishment of this nationwide study. Among the patients with pyogenic spondylitis (PS) and tuberculous spondylitis (TS) (n=13277), patients with previous diagnosis of the diseases within 1 year was excluded. Subsequently, patients under 20 years old were excluded followed by exclusion of patients diagnosed as both diseases.
Definition of PS and TS
A newly diagnosed PS or TS were defined by applying the following criteria : 1) presence of an ICD-10 code for PS or TS and 2) no previous same spondylitis code history (PS or TS) within 1 year and/or a history of inpatient hospitalization within 1 year (Table 1). The ICD-10 codes for PS were M46.2 (osteomyelitis of the vertebra), M46.3 (infection of the intervertebral disc [pyogenic]), M46.4 (discitis, unspecified), M46.5 (other infective spondylopathies), M46.8 (other specified inflammatory spondylopathies), M49.2 (enterobacterial spondylitis), and M49.3 (spondylopathy in other infectious and parasitic disease classified elsewhere). The ICD-10 code for TS was M49.0 (tuberculosis of spine) (Table 1).
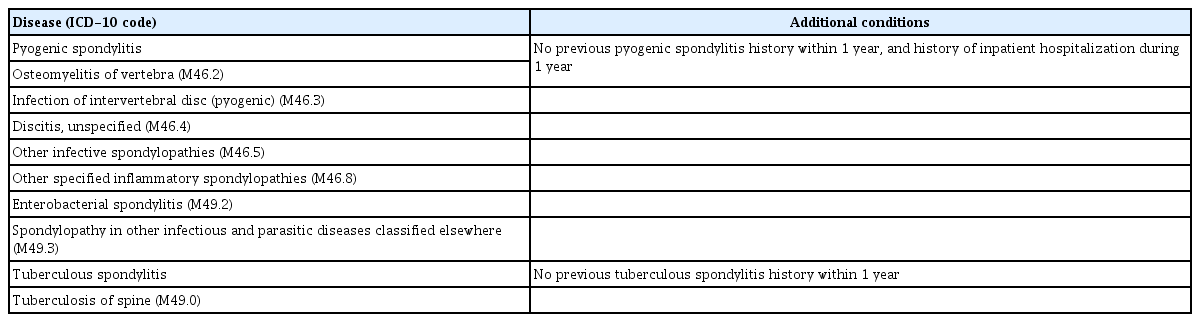
ICD-10 codes and additional conditions used to define the incidence of PS and TS
Statistical analyses
All rates were age-adjusted and expressed as a number per 100000 persons. The age-adjusted rates were standardized to the “Age Structure of Population in Korea” obtained from Statistics Korea. Logistic regression analysis was performed to evaluate incidence rates by age and comorbidities. Differences in incidence rates according to gender and year of diagnosis were assessed by using the chi-square test. The analyses were performed using SAS ver. 9.2 software (for Windows; SAS Institute, Cary, NC, USA).
RESULTS
Comparison of the PS and TS group between 2007 and 2016
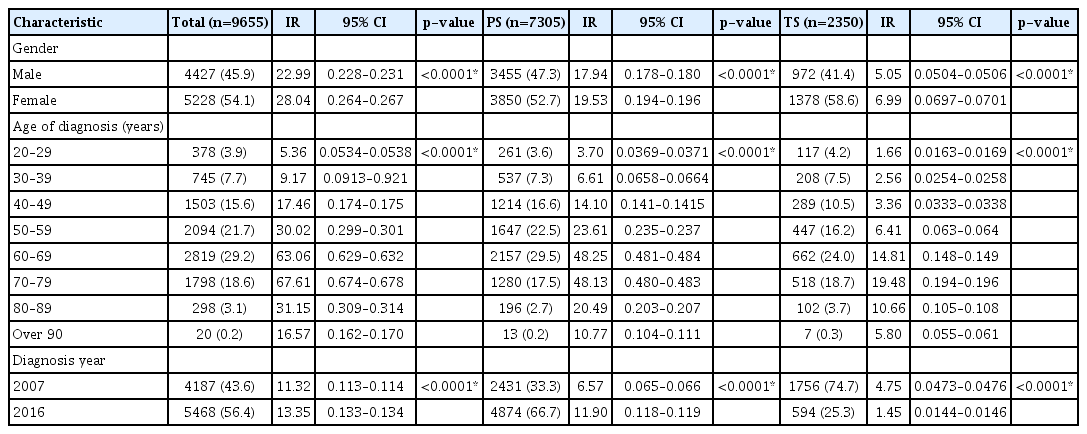
The overall incidence of infectious spondylitis was 9655 persons during the study period (Table 2). The mean age of the subjects was 58.0±14.0 years. Among them, PS and TS group consisted of 7305 and 2350 persons, respectively. Females showed predominance over males regarding both PS and TS (n=3850 vs. 3455 and 1378 vs. 972, respectively, p<0.0001). Similar inclination was also found in the incidence rate (19.53 vs. 17.94 and 6.99 vs. 5.05, p<0.0001). Mean age of females in PS and TS groups was 67.0±13.3 and 63.5±14.8 years. Mean age of males in PS and TS groups was 61.7±14.6 and 59.0±15.7. The incidence of PS among the eight age groups ranged from 13 to 2157 subjects with the 60–69 years age group having the highest PS incidence (p<0.0001). The 60–69 years age group also showed the highest incidence rate (48.25, p<0.0001). Sixty to 69 age group showed the highest peak in TS incidence with the range of seven to 662 subjects (p<0.0001). The incidence rate was the highest among 70–79 years age group (19.48, p<0.0001). There was a significant difference in the annual incidence of PS and TS between 2007 and 2016 (p<0.0001, Fig. 2). The incidence of PS in 2016 was significantly increased compared to that in 2007 (4874 vs. 2431, p<0.0001). The incidence rate of PS in 2016 was also increased compared to that in 2007 (11.90 vs. 6.57, p<0.0001). On the other hand, there was a decline in incidence of TS between 2007 and 2016 (1756 vs. 594, p<0.0001). The incidence rate of TS between 2007 and 2016 showed similar trend (4.75 vs. 1.45, p<0.0001, Table 2).
Characteristics of PS and TS group in year 2007 and 2016
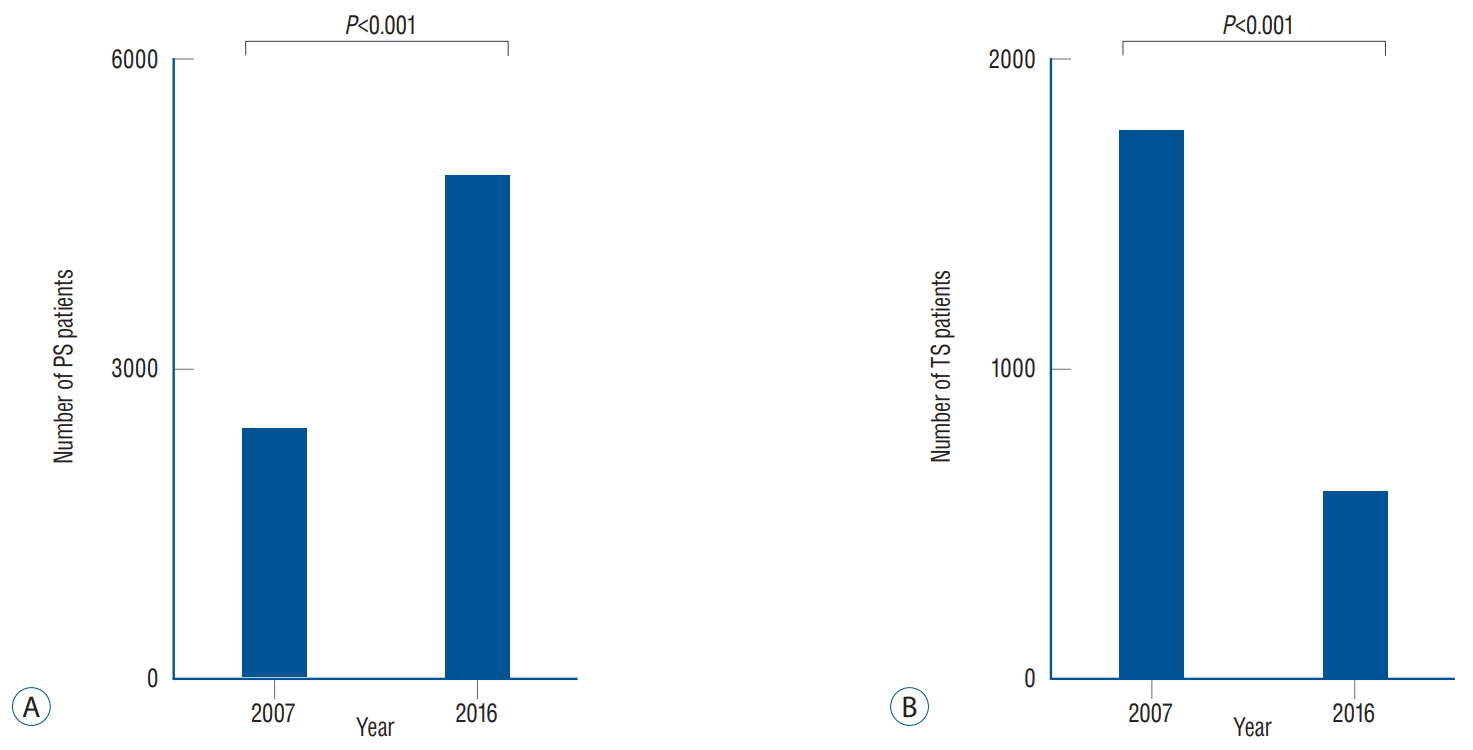
Comparison of the incidence of PS and TS in 2007 and 2016. A : The incidence of PS was significantly higher in 2016 compared to in 2007. B : The incidence of TS outnumbered in 2007 relative to in 2016 (P<0.0001). PS : pyogenic spondylitis, TS : tuberculous spondylitis.
Comparison of PS and TS group patients who underwent surgery
Of 9655 patients with newly diagnosed PS or TS, a total of 1721 patients underwent surgical treatment (Table 3). Among the 1721 treated patients, 878 patients were treated by fusion surgery and 843 patients were treated by decompression surgery. In gender analysis, males outnumbered females who underwent surgical treatment (931 vs. 790, p<0.0001). When the two surgical methods were stratified by patient age, the total number of patients who underwent surgery was the highest in the 60–69 years (n=568, p<0.0001). There was an increment of patients in 2016 relative to 2007, in both fusion and decompression group (541 vs. 337 and 481 vs. 362, respectively, p<0.0001). Similar inclination was also found in the incidence rate (1.32 vs. 0.91 and 1.18 vs. 0.98, respectively, p<0.0001).

Characteristics of PS and TS patients who underwent surgery
Among the 1721 surgically treated patients, the number of PS and TS group was 1571, and 150, respectively. Within seven age groups of PS patients, the 60–69 years age group showed the highest in PS group (n=520, p<0.0001). There was a significant difference in the incidence of surgically treated PS patients between 2007 and 2016 (592 vs. 979, p<0.0001, Table 4). The incidence rate of surgically treated PS in 2016 was also increased compared to that in 2007 (1.60 vs. 2.39, p<0.0001, Table 4).
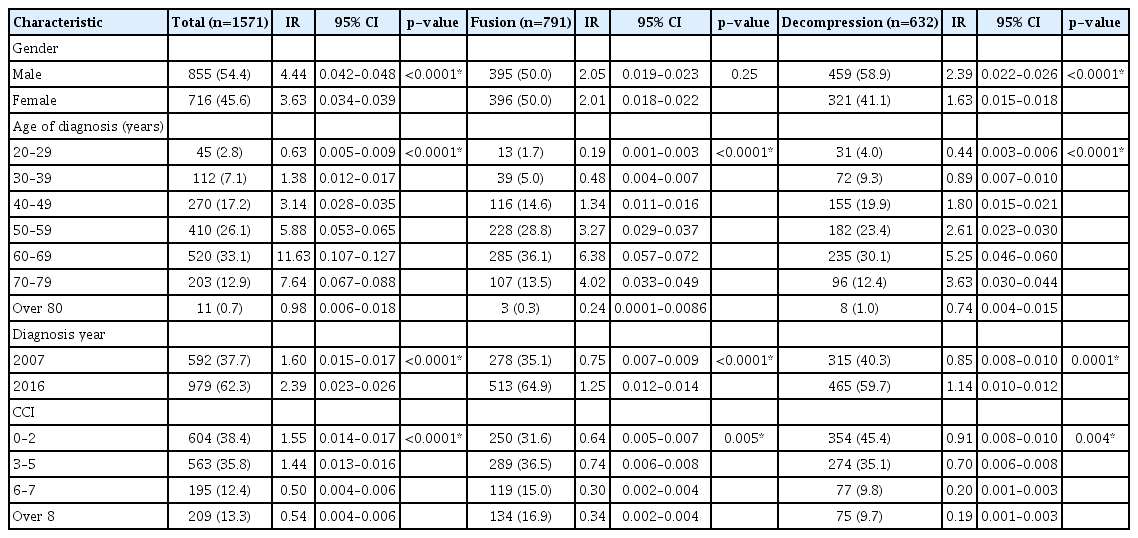
Characteristics of PS patients who underwent surgery
Among the 150 TS patients who underwent surgery, the number of patients treated with fusion and decompression was 87 vs. 63, respectively (Table 5). The 60–69 years age group showed the highest among the seven age groups (n=48, p<0.0001).
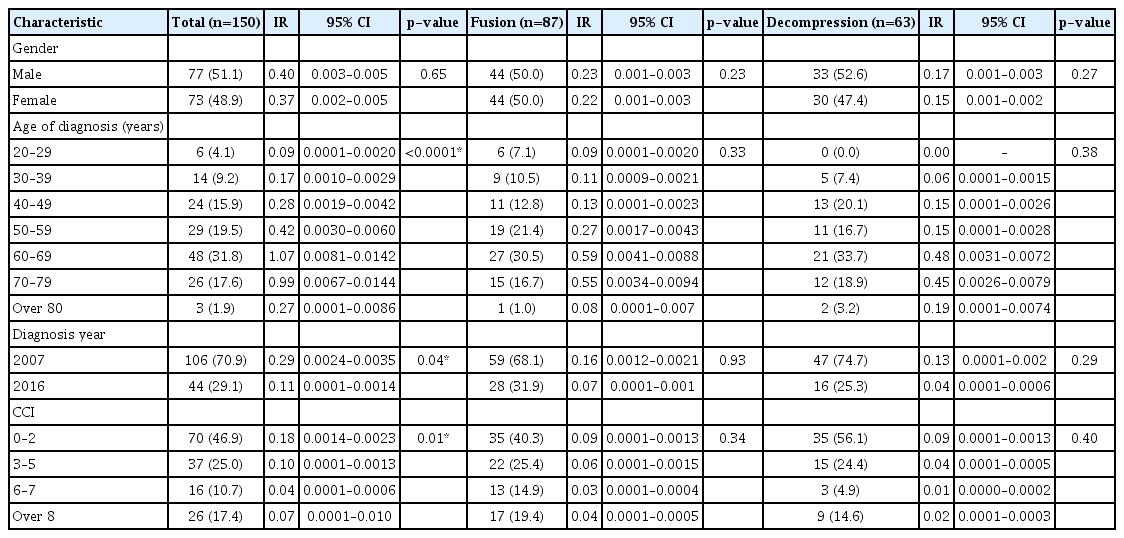
Characteristics of TS patients who underwent surgery
DISCUSSION
The present study is the first nationwide study to demonstrate the change of incidence in PS and TS between 2007 and 2016. Our study found that the incidence of PS was significantly increased while TS was significantly decreased between 2007 and 2016. In addition, the overall inclination was found in PS patients treated with surgery.
There have been several reports for possible causes of increased PS incidence rate. Some studies suggested risk factors such as increased prevalence of intravenous drug abuse and of patients with immunosuppression [5-8,25]. Some studies reported that the increase in PS could be related to the increasing ratio of aged people [3,15]. Availability of better diagnostic methods may also have contributed to the increase in PS incidence [7,8,13,15,33].
Some studies suggested that the trend is due to an increase in nosocomial infection rate related to surgery or vascular devices or other medical procedures [9,25]. One study found that 60% of 20 infectious spondylitis cases were derived from nosocomial acquisition, and a recent review insisted that hospital-acquired infection may have contributed to the increase in spinal infections [10,24,32]. A retrospective cohort study ended up having around 20% of nosocomial acquisition [1,23,24]. The increase in surgical and nonsurgical spine procedure is considered to be one of the main factors, and has been reported in previous studies [21].
The incidence of TS may be decreased in parallel with declination of patients diagnosed as tuberculosis. Our study found out that the incidence of TS in 2016 was almost one third of that in 2007. Infection caused by Mycobacterium tuberculosis seems to be decreasing due to improved public hygiene and good tuberculosis control [4].
In addition to changes in incidence of PS and TS, we investigated distribution of patients according to their ages. Similar to previous studies, 60–69 years of age were the most prone to vertebral infectious disease [8,10,11]. Correlation of age and infectious spondylitis may derive from immunodeficiency of the elders.
We discovered that preferred surgical methods were different among age groups. In PS group, patients between 20s and 40s were treated mainly with decompression surgery while the elders in their 60s and 70s underwent fusion surgery. Most TS patients underwent fusion surgery in their 60s and 70s.
Several limitations in this study should be noted. First, due to the basic limit of the NHIS database, it could not depict regional variations in disease diagnosis or reporting, such as differences between those in cities and in rural areas. Second, because deidentified datas ware provided from NHIS, we could not obtain each individual’s all clinical information such as the quality of life, the severity of pain, and specific microorganism of spondylitis. Third, the presence of additional conditions is inevitable when creating research definitions for newly diagnosed PS and TS patients. Despite these limitations, to the best of our knowledge, our study is the largest nationwide study to compare the incidence of PS and TS in longest follow-up duration.
CONCLUSION
The present nationwide study suggests that PS is increasing and TS is decreasing in Korea. Furthermore, demand for surgery regarding PS is increasing.
Notes
No potential conflict of interest relevant to this article was reported.
INFORMED CONSENT
This type of study does not require informed consent.
AUTHOR CONTRIBUTIONS
Conceptualization : YJK, JBH
Data curation : JY, JMC
Formal analysis : YJK, JY, JMC
Funding acquisition : SS
Methodology : JY, SS
Project administration : JBH, SS
Visualization : YJK, JY, JMC
Writing - original draft : YJK, YSK
Writing - review & editing : JBH, SS
Acknowledgements
This work was supported by Basic Science Research Program through the National Research Foundation of Korea (NRF) funded by the Ministry of Education (NRF2020R1F1A1069875) and the Ministry of Science, ICT and future Planning (NRF-2016M3A9E8941668).