Cerebrospinal Fluid Profiles and Their Changes after Intraventricular Chemotherapy as Prognostic or Predictive Markers for Patients with Leptomeningeal Carcinomatosis
Article information

Abstract
Objective
Here, we evaluated whether cerebrospinal fluid (CSF) profiles and their changes after intraventricular chemotherapy for leptomeningeal carcinomatosis (LMC) could predict the treatment response or be prognostic for patient overall survival (OS) along with clinical factors.
Methods
Paired 1) pretreatment lumbar, 2) pretreatment ventricular, and 3) posttreatment ventricular samples and their CSF profiles were collected retrospectively from 148 LMC patients who received Ommaya reservoir installation and intraventricular chemotherapy. CSF profile changes were assessed by calculating the differences between posttreatment and pretreatment samples from the same ventricular compartment. CSF cell counts were further differentiated into total and other based on clinical laboratory reports.
Results
For the treatment response, a decreased CSF ‘total’ cell count tended to be associated with a ‘controlled’ increase in intracranial pressure (ICP) (p=0.059), but other profile changes were not associated with either the control of increased ICP or the cytology response. Among the pretreatment CSF profiles, lumbar protein level and ventricular cell count were significantly correlated with OS in univariable analysis, but they were not significant in multi-variable analysis. Among CSF profile changes, a decrease in ‘other’ cell count showed worse OS than ‘no change’ or increased groups (p=0.001). The cytological response was significant for OS, but the hazard ratio of partial remission was paradoxically higher than that of ‘no response’.
Conclusion
A decrease in other cell count of CSF after intraventricular chemotherapy was associated with poor OS in LMC patients. We suggest that more specific CSF biomarkers of cancer cell origin are needed.
INTRODUCTION
Leptomeningeal carcinomatosis (LMC) is a devastating complication that occurs in 1% to 15% of patients with solid tumors [6,8,36], and its prognosis is poor, as the median overall survival (OS) time is approximately 8 weeks without treatment [20,28]. Standard therapies include intra-cerebrospinal fluid (CSF) chemotherapy and involved field radiation for bulky disease [19,20,31]. However, the survival benefit is marginal, and patients lose their performance quickly from both the direct leptomeningeal involvement of cancer cells and the obstruction of physiologic CSF flow [5,7,17].
LMC is diagnosed by clinical features, neuroimaging studies, and cancer cells on CSF examination [15]. CSF cytology is a definite diagnosis of LMC. However, a single cytology examination frequently yields a false negative result in up to 40–50% of patients [18]. T1-weighted gadolinium-enhanced magnetic resonance imaging (MRI) is a standard radiological examination [34,35]. However, leptomeningeal enhancement itself is not specific for LMC, and the reported false negative rate of MRI is still approximately 30% [45]. From an oncologic point of view, CSF cytology negative conversion is the ultimate goal of therapy. However, it is difficult to consider ‘one-time’ negative CSF cytology results as a response, and even two consecutive negative CSF cytology results that are sustained for 1 month are not correlated with prolonged survival [10,22]. Well-known response criteria for solid tumors, such as the Response Evaluation Criteria in Solid Tumours or Response Assessment in Neuro-Oncology for central nervous system (CNS) tumors, are not applicable to LMC, as it does not show ‘dimension’ but rather a streaky pattern on MRI [30,38,43].
In patients with LMC, CSF profiles such as cell count, protein, lactate dehydrogenase (LDH), and several tumor-specific antigens/proteins are elevated as a result of the disease. Many studies have attempted to correlate these CSF profiles with prognosis and to provide evidence of a treatment response from CSF profile changes [3,4,14,25,42,44]. However, the results have been inconsistent, likely due to the small number of patients evaluated and the heterogeneity of the treatments given. Furthermore, some CSF profiles vary largely depending on the systemic status of the patient and the sampling conditions [11,42]. In a previous study by our group, we described the differences in CSF profiles in patients with LMC according to the sampling site and the association of CSF profiles with LMC disease activity [33].
In this study, we analyzed the CSF profiles of a relatively large number of patients who received the same treatment modality, intraventricular chemotherapy, to evaluate whether 1) initial CSF profiles such as the protein level and cell count are prognostic for OS and 2) CSF profile changes after treatment could either be prognostic for OS or predictive for the treatment response of CSF cytology negative conversion and increased intracranial pressure (ICP) control. We also evaluated various clinical factors for their influence on patient OS along with these CSF profiles.
MATERIALS AND METHODS
Study design and selection of matched CSF samples
For this retrospective analysis, we retrieved data from electric medical records on 283 consecutive patients with LMC from solid cancer who received Ommaya reservoir insertion between 2003 and 2013 after obtaining Institutional Review Board of National Cancer Center permission (NCC-2014-0135). First, we evaluated whether these patients were subjected to proper pretreatment CSF profile studies in addition to CSF cytology for LMC diagnosis and excluded 38 patients with CSF cytology only and another 17 patients without lumbar CSF samples before Ommaya installation (Fig. 1). Among the 228 patients who underwent both pretreatment lumbar and ventricular CSF profile studies, 24 who received different intensities of ‘ventriculolumbar perfusion (VLP)’ chemotherapy, which significantly affects patient OS, were excluded [23], and 21 patients who did not undergo further intraventricular chemotherapy were also excluded. Among the 183 patients who had matched pretreatment lumbar and ventricular CSF samples, 35 without posttreatment CSF profile studies were excluded, and 148 patients were enrolled and analyzed in this study.

Flow diagram of patient selection. LMC : leptomeningeal carcinomatosis, CSF : cerebrospinal fluid.
Designation of CSF samples according to the sampling time and compartment
CSF samples were defined according to the sampling time and CSF compartment from which they were obtained : 1) the ‘pretreatment lumbar’ sample was used for the diagnosis of LMC via lumbar puncture, 2) the ‘pretreatment ventricular’ sample was obtained during Ommaya intraventricular reservoir installation, and 3) the ‘posttreatment ventricular’ sample was selected as the last treatment sample among those samples obtained via the Ommaya reservoir in every round of intraventricular chemotherapy.
Evaluated clinical and CSF parameters
Clinical characteristics were evaluated as candidate factors to determine whether they influenced the end results. All CSF profiles were obtained from clinical laboratory reports of electric medical records. CSF cell counts were further divided into total and others, which morphologically represent cells other than white blood cells. CSF protein levels were evaluated as the main parameter along with glucose and LDH levels, which were measured to control bias from CSF infection or sample hemolysis.
CSF profile changes were assessed by calculating the differences between posttreatment and pretreatment ventricular samples from the same compartment.
End result parameters
We defined the end results as patient OS and the treatment response. The treatment response was evaluated by examining CSF cytology and the control of increased ICP (>15 cm H2O on Ommaya insertion). Cytological response was defined according to the criteria modified from Chamberlain and Kormanik [10] as previously described [22]. Briefly, complete remission (CR) was defined as two consecutive negative CSF cytological examinations at least 1 week apart that were sustained for at least 1 month. Partial remission (PR) was defined as two consecutive negative CSF cytological examinations that failed to be sustained for at least 1 month or were interrupted by an ‘atypical’ or a ‘positive’ finding. We considered both CR and PR as a response but did not accept one-time conversion to atypical cells from positive as a response.
Statistical analysis
CSF profiles of the pretreatment lumbar, pretreatment ventricular, and posttreatment ventricular samples were compared using the Wilcoxon signed-rank test. Changes in CSF profiles were defined as a decrease, no change, or increase by using the difference between the pretreatment ventricular and posttreatment ventricular CSF profiles from the same compartment. The association between changes in CSF profiles and the treatment response in terms of ICP control and cytology response after intraventricular chemotherapy was evaluated using the chi-squared test or Fisher’s exact test.
The association of clinical variables, CSF profiles and their changes on OS were evaluated using the Cox proportional hazards model. The variables with marginal effects based on the univariable analysis (p≤0.2) were included in the multivariable analysis, and the final model was determined using the backward selection method with an elimination criterion of a p-value >0.05. The Kaplan-Meier curves with log-rank test p-values are presented for the significant variables in the final model. We considered a p-value of less than 0.05 to be statistically significant. All statistical analyses were performed using SAS ver. 9.4 (SAS Institute, Inc., Cary, NC, USA) and R project software (version 3.6.2; The R Foundation for Statistical Computing).
RESULTS
Clinical characteristics of the patients
The clinical characteristics of the 148 patients are summarized in Table 1. The median patient age was 53.5 years (range, 23–76). The majority of patients had non-small cell lung cancer (NSCLC; 68%), followed by breast cancer (24%) and small cell lung cancer. The other patients had stomach cancer (n=3), pancreatic cancer, ovarian cancer, salivary gland cancer, lymphoma and colon cancer (n=1 each). Three-fourths of the patients had systemic disease on progression. Concomitant parenchymal brain metastasis at the time of LMC diagnosis was found in 106 patients (72%). Headache with nausea and vomiting were the most common presenting symptoms (85%), followed by confused mentality and cauda equina syndrome (28% and 16%, respectively). Increased ICP was identified in 71 patients (48%). One hundred thirty-five patients (91%) had positive cytology results, and 13 patients without positive cytology results had evident MR findings with clinical LMC symptoms before intraventricular chemotherapy.
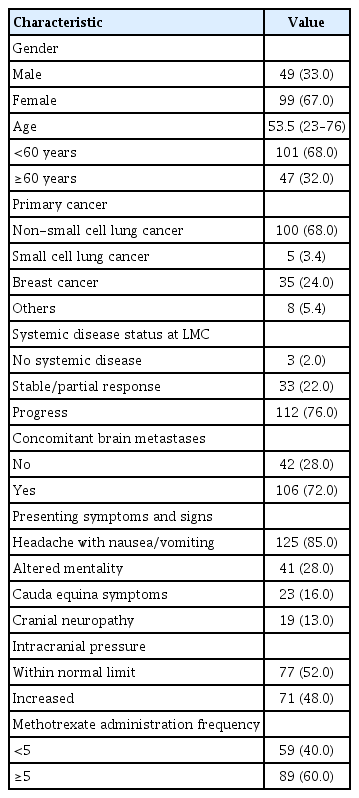
Pretreatment clinical characteristics of the patients with leptomeningeal carcinomatosis (n=148)
All included patients received conventional intraventricular chemotherapy weekly or twice weekly via the Ommaya reservoir. Before the injection, CSF (5–10 mL) was withdrawn for reservoir patency confirmation and evaluated for CSF cytology and profiles. The applied regimen was methotrexate (MTX) monotherapy or the triple regimen (MTX, cytarabine and hydrocortisone) as previously described [22]. Intraventricular chemotherapy was administered at a median of 5 rounds at the physician’s discretion (range, 1–49).
CSF profiles and their changes after treatment
The profiles of pretreatment ventricular and lumbar CSF were shown in Table 2. The median pretreatment lumbar CSF ‘total’ cell count was 10 cells/mm3 (range, 0–390), with a mean of 32.5 (standard deviation [SD], 65.5). The median ‘other’ cell count was 4 (range, 0–300), with a mean of 16.7 cells/mm3 (SD, 38.6). The median pretreatment lumbar CSF protein level was 65.5 mg/dL (range, 14–1790), with a mean of 136.5 mg/dL (SD, 220.3). These values were significantly higher than those of pretreatment ventricular CSF reported in a previous study [1] (p<0.001 for the cell count and <0.001 for the protein level). The median pretreatment ventricular CSF total cell count was zero (range, 0–390), with a mean of 13.5 cells/mm3 (SD, 53.9). The median other cell count was zero (range, 0–300), with a mean of 5.5 cells/mm3 (SD, 28.2). The median pretreatment ventricular CSF protein level was 18 mg/dL (range, 6–200), with a mean of 27.8 mg/dL (SD, 28.4).
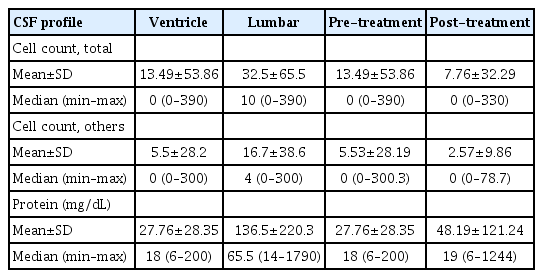
The profiles of pretreatment ventricular and lumbar CSF and the change of those profiles after the intraventricular chemotherapy
After we confirmed the significant difference in CSF profiles between pretreatment samples from different compartments, we measured CSF profile changes after treatment by comparing those from the same compartment (posttreatment ventricular–pretreatment ventricular). After treatment, the median CSF profile remained at zero, but the cell count range became narrower while the protein level became broader, and the results of the Wilcoxon signed-rank test were all significantly different between pretreatment and posttreatment.
In posttreatment ventricular samples, the CSF total cell count decreased to a mean of 7.8 cells/mm3 (SD, 32.3), and the other cell count decreased to a mean of 2.6 cells/mm3 (SD, 9.9) with statistically significant differences (p=0.003 and 0.004, respectively). The mean CSF protein level posttreatment was 48.2 mg/dL (SD, 121.2), and the median was 19 mg/dL (range, 6–1244). In contrast to the CSF cell count, the CSF protein level was significantly increased after treatment (3=0.014).
As depicted in Fig. 2, in the matched-pair analysis of the pre- and posttreatment values of individual patients, the change in the CSF cell count after treatment varied among the patients. After treatment, the CSF total cell count decreased in 63 patients (43%), with a median of 5 cells/mm3, did not change in 62 patients (42%), and increased in 23 patients (16%), with a median of 18 cells/mm3. The other cell count did not change in 70 patients (47%), decreased in 56 patients (38%), with a median of 7 cells/mm3, and increased in 22 patients (15%), with a median of 14 cells/mm3. A matched CSF protein level was acquired in 136 patients; this level was increased in 77 patients (57%), decreased in 56 patients (41%), and did not change in three patients (2.2%).

Interaction plot depicting changes in the (A) total cell count, (B) other cell count, and (C) protein level between pretreatment and posttreatment ventricular CSF samples. After the intraventricular chemotherapy, total cell count and ‘other cell count’ were decreased significantly (to mean 7.8 and 2.6 cells/mm3, respectively). In contrast to the CSF cell count, the CSF protein level was significantly increased after the treatment (to 48.2 mg/dL, p=0.014). See details in the Results section. CSF : cerebrospinal fluid.
Association of CSF profile changes with treatment responses
Among the 71 patients with increased ICP, 21 (30%) achieved ICP control after treatment. However, 23 patients with normal ICP prior to treatment experienced increased ICP during treatment. Hence, total ICP control was achieved in 75 patients (51%).
Cytology was able to be evaluated after treatment in 133 patients. The majority of patients (86, 65%) had no cytology negative conversion. Among the remaining patients, 40 (30%) achieved PR, and seven (5%) achieved CR.
We evaluated whether CSF profile changes (posttreatment– pretreatment) were associated with the treatment response (Table 3). Only the CSF total cell count tended to be associated with a large proportion of patients with a ‘controlled’ increase in ICP and a decreased cell count after treatment (p=0.059), but these cell count changes failed to show an association with the cytology response. The other profile changes (i.e., other cell count and protein level) showed no association with either the control of ICP or the cytology response.

Association between the changes of CSF profile changes and the treatment response
Influence of clinical factors, CSF profiles, and their changes on OS
During the study period, 145 patients (98%) expired, and the median OS was 2.96 months (95% confidence interval [CI], 2.50–3.39). We also evaluated whether CSF profiles and their changes could be prognostic factors for OS along with other clinical factors (Table 4). Among the clinical factors, old age (≥60 years), primary cancer other than the lung, and presenting symptoms of altered mentality had a significant adverse effect on OS in the univariable analysis (p<0.05). Conversely, ≥5 rounds of MTX administration (p<0.001) were favorably correlated with OS. Cytology negative conversion did not significantly influence OS.
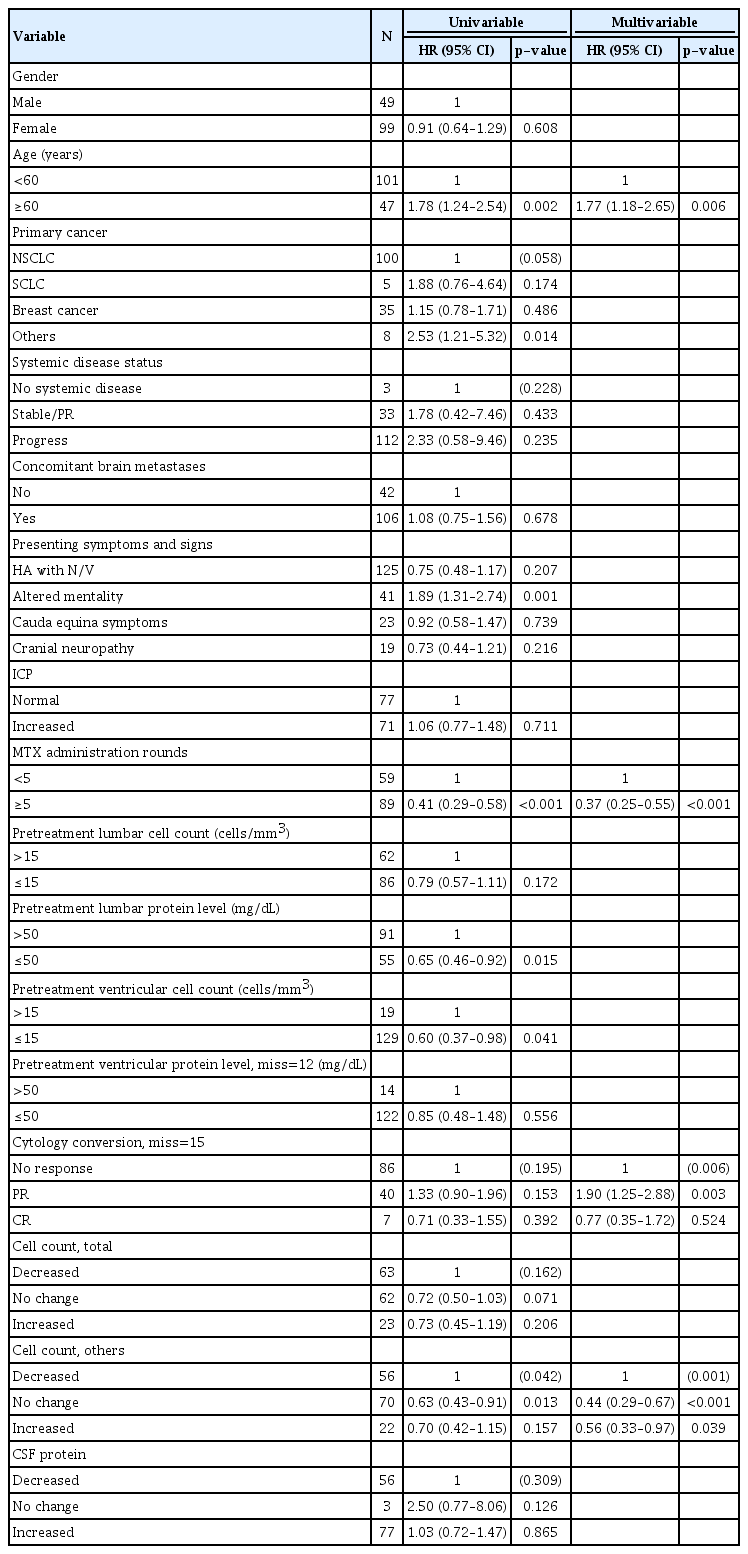
Analysis of clinical variables with CSF profiles and their changes after intraventricular chemotherapy on patients’ overall survival
The pretreatment CSF profiles were arbitrarily divided into two groups. Among the pretreatment CSF profiles, a low pretreatment lumbar protein level (≤50 mg/dL) and the pretreatment ventricular total cell count (≤15 cells/mm3) were predictive of prolonged OS (p=0.015 and 0.041, respectively). In terms of CSF profile changes after treatment, there was a significant difference in at least one of the three groups : decreased, no change, and increased (p=0.042). A decrease in other cell count was associated with worse OS than no change (p=0.013)
In the multivariable analysis, the negative influence of old age on OS and the positive influence of ≥5 rounds of intraventricular chemotherapy on OS remained statistically significant (p=0.006 and <0.001, respectively, Fig. 3A and B). The cytology response became significant in the multivariable analysis. However, although the hazard ratio of PR (compared to ‘no response’; 1.90; 95% CI, 1.25–2.88) drove the statistical significance, it was not clinically relevant (Fig. 3C). A decrease in other cell count of CSF after treatment also negatively affected patient OS (compared to both ‘no change’ and increased cell count) in the multivariable analysis (p<0.001 and 0.039, respectively, Fig. 3D).
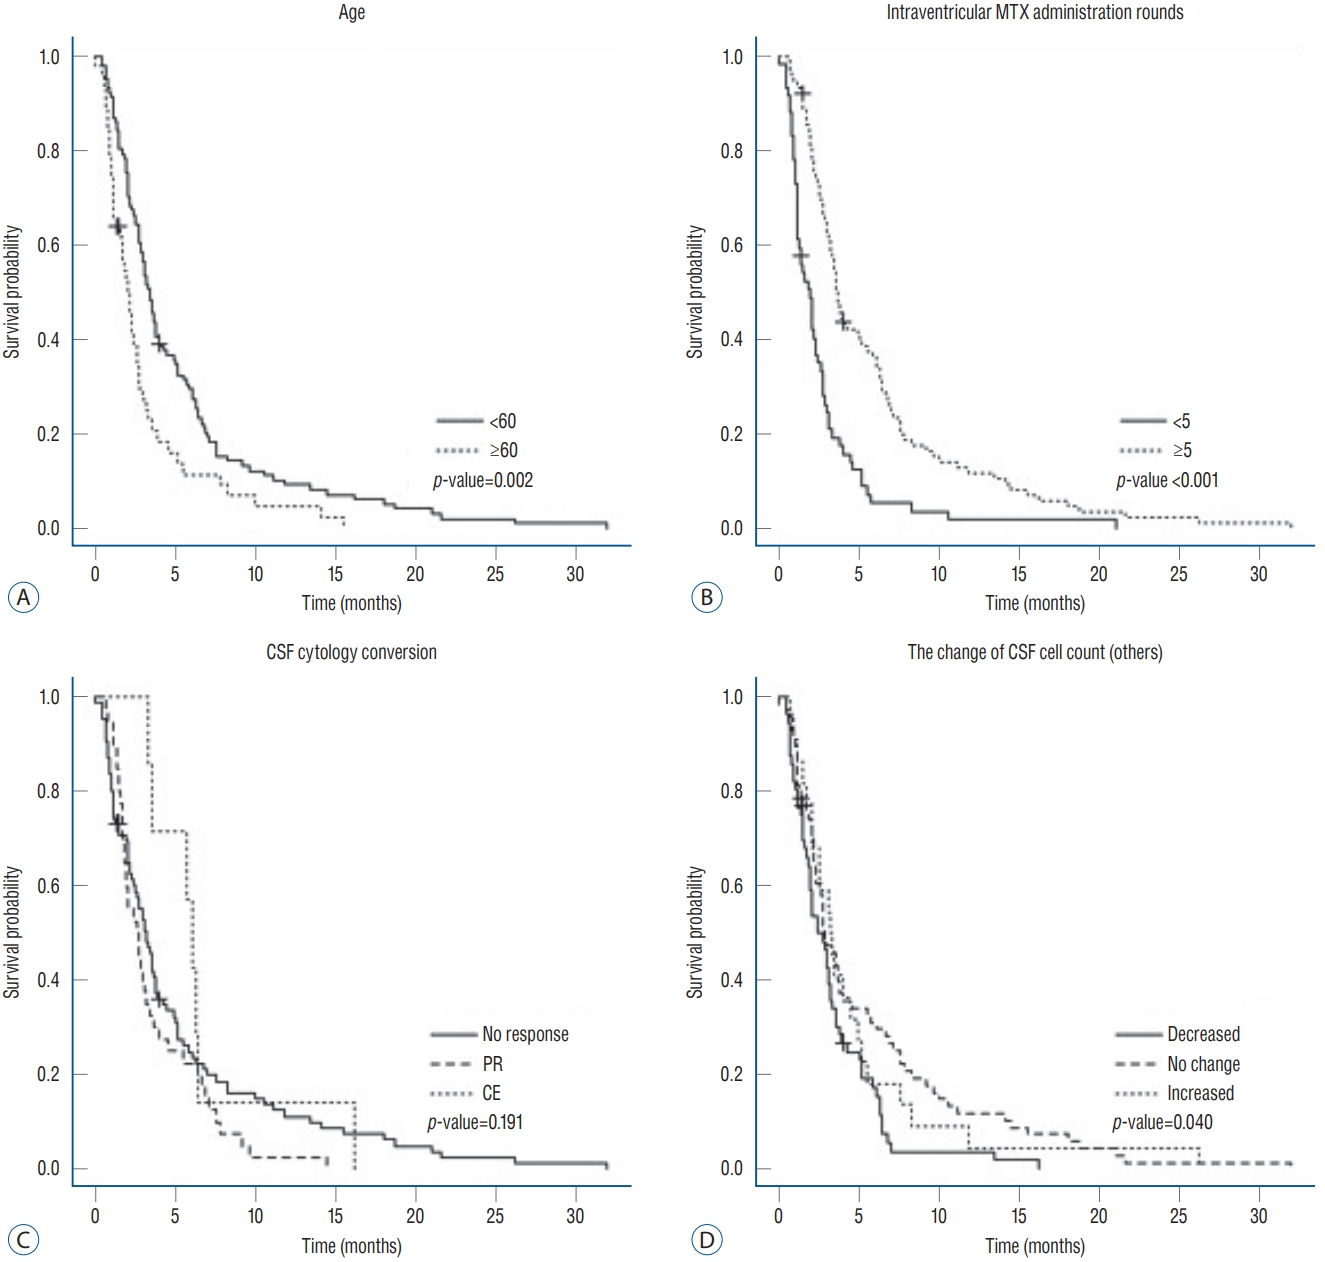
Kaplan-Meier plot of patient overall survival according to variables that were significant in the multivariable analysis : (A) age (<60 vs. ≥60 years), (B) rounds of intraventricular methotrexate administration (<5 vs. ≥5), (C) CSF cytology conversion, and (D) change in the CSF cell count (other). MTX : methotrexate, CSF : cerebrospinal fluid.
In the subgroup analysis of NSCLC, 28 patients received receptor tyrosine kinase (RTK) inhibitors after LMC diagnosis concomitantly with the intraventricular chemotherapy showed significantly prolonged OS compared to patients without concomitant RTK inhibitor (p=0.008, Supplementary Fig. 1).
DISCUSSION
Despite the limitations of a retrospective study, our CSF profile changes (posttreatment–pretreatment from the same ventricular compartment) after intraventricular chemotherapy were minimized by bias from different sampling sites, and our categorization of ‘decreased’, ‘no change’, and ‘increased’ was from paired samples of individual patients. To our knowledge, this study is the largest series of CSF profiles from patients who underwent the same treatment for LMC.
CSF profiles in LMC
CSF is supposedly free of cells, and low levels of various materials, such as proteins (as specialized capillaries of the bloodCSF barrier), selectively filter these from the systemic circulation. Elevated CSF protein levels and cell counts combined with low glucose levels have been observed in patients with LMC since early eras of intrathecal chemotherapy [42]. As these CSF profile changes are the consequence of LMC activity, it is natural to correlate these CSF profiles with LMC severity or prognosis. However, these profiles are nonspecific to LMC and vulnerable to being influenced by sampling conditions or the systemic status of the patient. In nature, these profiles originate from either cancer cells or immune cells. In the literature, the prognostic meaning of these two important CSF profiles (i.e., cell counts and protein levels) have varied among studies [1,3,4,6,12,25], and their associations with LMC symptoms and disease severity have not been well studied.
In our previous study, the lumbar CSF protein levels in patients with cauda equina involvement were higher than those in patients without involvement [33]. We also verified the differences in CSF profiles in LMC patients according to the sampling site, as lumbar CSF has significantly higher cell counts and protein levels than ventricular CSF. Consistent with the previous results, the pretreatment lumbar CSF cell count and protein levels were significantly higher than those of pretreatment ventricular CSF in this study.
Predictive biomarker for the treatment response in LMC patients
Chamberlain et al. [9] summarized problems associated with assessing the treatment response in LMC patients. They suggested the following difficulties in the use of a CSF biomarker : 1) the assay for the biomarker needs to be standardized among institutions, 2) disturbed CSF flow in LMC patients results in variable levels of CSF biomarkers according to the sampling site, and 3) the time point at which CSF is sampled may influence the expression levels along the disease course.
CSF protein levels or tumor-specific antigens have historically been used to assess cancer burden or to monitor the treatment response in LMC patients since the early 1980s. Hitchins et al. [26] studied 44 patients with breast cancer and reported a good response to therapy in patients with elevated protein levels (>0.50 g/dL). Nakagawa et al. [32] followed CEA and beta-glucuronidase levels in CSF after intrathecal chemotherapy with MTX. They reported a decrease in these profiles after treatment and suggested that this decrease can be used to monitor the disease course [32]. However, their findings of decreased CEA and beta-glucuronidase levels were obtained from only four and two patients with LMC, respectively. Twijnstra et al. [40] followed the LDH level in ventricular CSF after intraventricular chemotherapy in 24 patients with LMC and verified that the decreased LDH level after treatment was associated with a clinical improvement. Recently, Hyun et al. [27] evaluated the change in CYFRA 21-1 levels after VLP MTX chemotherapy and found that this change correlated with the Karnofsky performance status (KPS) score and ICP. They also showed dynamic changes in CYFRA 21-1 levels during the course of treatment and insisted that high CSF CYFRA 21-1 levels were significantly associated with the KPS score and ICP, whereas CSF protein levels were not. However, their CYFRA 21-1 level was neither an absolute threshold level nor the consequence of changes after treatment but rather the resultant level after treatment.
In this study, we evaluated whether the CSF cell count and protein level and their changes after treatment from the same ventricular CSF compartment were associated with the treatment response. Among the pretreatment CSF profiles, the pretreatment lumbar protein level and pretreatment ventricular cell count showed a significant association with patient OS in the univariable analysis. Considering the direction of prolonged OS with lower pretreatment profiles, we suggest that pretreatment CSF profiles might indicate disease burden in patients with LMC. These assumptions are supported by several studies evaluating CSF profiles as prognostic markers in LMC [1,6,13,14,25,32]. The prognostic significance of CSF, not total but rather other cell count, was not evaluated in previous studies. Under the assumption that CSF profiles are derived from both immune cells and cancer cells in LMC, it is likely that cancer cell activity could reveal the possibility of biomarkers. However, we were unable to confirm that the increased cell count was from dying cells as the result of cytotoxic chemotherapy.
Prognostic factors for LMC treated with intra-CSF chemotherapy
As with other cancer metastases involving the CNS, the prognosis of LMC is affected by factors such as the primary cancer type, systemic cancer status, patient performance status, and therapeutic intervention given after metastasis [6,8,13,16,22,24,25,41]. In our previous study, we evaluated the prognostic factors for OS in 105 patients with LMC from one primary cancer of NSCLC who received intraventricular chemotherapy [22]. Old age (≥60 years), a poor KPS score (<70), and uncontrolled ICP were found to be unfavorable prognostic factors, and many rounds of intraventricular chemotherapy and concurrent systemic chemotherapy significantly improved OS in the multivariable analysis. In this study, age and rounds of intraventricular chemotherapy were also significant prognostic factors. And the positive effect of systemic chemotherapy on OS in NSCLC patients were reconfirmed.
Among the candidate prognostic factors for LMC, CSF cytology is not only nonspecific to LMC (it is also indicative of parenchymal brain metastasis) but also problematic in judgment. From an oncologic point of view, CSF cytology conversion from positive to negative could be defined as ‘complete remission’ of other cancers. However, frequent false negative CSF cytology is a well-known problem when estimating the treatment response. In a combined retrospective analysis of 874 patients with LMC, the sensitivity of CSF cytology varied from 40% to 100% depending on how many times the CSF examination was repeated [24]. To overcome this problem, Chamberlain and Kormanik [10] suggested ‘two consecutive negative cytology results 1 week apart that are sustained for at least 1 month’ as the criteria for CR, but we modified the criteria, as the authors did not consider the conversion of positive cytology to atypical cells to be remission [22]. Both studies included a considerable number of patients (n=32 and 105, respectively) with one primary cancer (NSCLC), but CSF cytology responses did not correlate with improved OS. Another problem associated with evaluating patient prognosis is that CSF cytology is correlated with neither patient OS nor the clinical response after treatment [9,10,16,21,22]. Chamberlain et al. [9] reported that CSF cytology clearing and resolution on enhanced MRI are correlated neither with a clinical improvement nor with each other. It was suggested that this finding may be because the cause of death is greatly influenced by the primary cancer, and approximately half of patients with LMC supposedly die of non-CNS-related issues, making it difficult to identify reliable criteria for LMC-specific death. Harstad et al. [24] evaluated whether cancer burden, evaluated in terms of positive CSF cytology and bulky CNS disease on MRI, was inversely correlated with OS in 110 patients with one primary cancer, leptomeningeal melanomatosis, but found no correlation with OS. In this study, the cytology response became significant in the multivariable analysis, but the hazard ratio of PR was higher than that of no response, which did not show clinical significance.
We introduced CSF profiles as prognostic factors not only as initial values but also as changes after treatment to evaluate whether these changes can be developed as a biomarker for the treatment response. Cox regression analysis of prognostic factors confirmed that changes in the CSF other cell count were significant prognostic factors for OS, whereas changes in the CSF total cell count were not. We hypothesize that this discrepancy suggests the importance of the origin of CSF contents, which is from both cancer cells and the host immune response. Furthermore, there is a different prognostic meaning of cell count. The ‘initial’ cell count was an unfavorable prognostic factor for disease burden, but an increased other cell count after treatment was a favorable prognostic factor. Thus, we hypothesized that an increased other cell count may be derived from increased cancer cell detachment from leptomeninges, as they lose vitality after treatment. Our hypothesis should be supported by molecular-level profiles such as the apoptotic index and epigenetic changes in dying cells. However, technical difficulties and the lack of standardized measurements for these changes are obstacles to address when solving these problems.
Recently, several researchers have concentrated on microRNAs or metabolites, which can be specific to cancer cells [2,37]. Some have reported promising results for the diagnosis and evaluation of the treatment response in LMC patients using a new method enumerating tumor cells in CSF [29,39]. We agree with these studies on the necessity of new quantitative CSF biomarkers, as our study confirmed that simple changes in CSF profiles, such as the protein level and cell count, may not be useful as predictive or prognostic markers.
Limitations
Due to the retrospective nature of this study, our analysis was performed on the limited number of cases receiving the intraventricular chemotherapy during the study period. Major flaw is that we did not have a constant number of the treatment given. This is from the lack of protocol for the intraventricular chemotherapy, sampling time and CSF profiles at each injection except prescribed MTX dose. As we defined the posttreatment samples to be the last sample of the intraventricular chemotherapy, the posttreatment samples were obtained after from 1 to 49 times of the treatment. Another flaw is the definition of the ‘other cells’ percentage. This evaluation is based on the technician’s discretion under the microscope. Currently, we do not have any practically available automated or specified identifying criteria or tools to differentiate cancer cells from immune cells in CSF. Thus, our conclusion might be not decisive but suggestive.
CONCLUSION
This study was limited to the number of intraventricular chemotherapies given and the posttreatment CSF sampling time, which varied among patients. Moreover, although this was a retrospective study, we performed individual matchedpair analyses of the profile changes. Changes in the other cell count after treatment influenced the OS of LMC patients, while other CSF profiles and their changes after intraventricular chemotherapy were neither predictive for the treatment response nor prognostic for OS. This result might provide an ideal characteristic of a CSF biomarker for LMC (i.e., to be of cancer cell origin), as the total cell count and protein levels are derived from either cancer cells or immune cells. We need more specific quantitative CSF biomarkers for LMC treatment to improve the efficacy of intraventricular chemotherapy.
Notes
CONFLICTS OF INTEREST
No potential conflict of interest relevant to this article was reported.
INFORMED CONSENT
Informed consent was obtained from all individual participants included in this study.
AUTHOR CONTRIBUTIONS
Conceptualization : HSG
Data curation : JWK, YS, HY, SHS
Formal analysis : EYP, JJ
Funding acquisition : HSG
Methodology : HSG, EYP, JJ
Project administration : JWK
Visualization : EYP, YS
Writing - original draft : JWK
Writing - review & editing : HSG, EYP, JJ, HY, SHS
Acknowledgements
This work was supported by a grant (1910090-2) from the National Cancer Center, Korea. The sponsor had no role in the design or conduct of this research.
Supplementary materials
The online-only data supplement is available with this article at https://doi.org/10.3340/jkns.2020.0300.
Kaplan-Meier plot of patient overall survival according to whether or not receptor tyrosine kinase (RTK) inhibitors was administered after leptomeningeal carcinomatosis (LMC) diagnosis.