Profile and Outcome of Management of Brain Tumours in Kaduna Northwestern Nigeria
Article information

Abstract
Objective
Tumours of the brain are a rare occurrence accounting for approximately 2% of all neoplasms in adults. Few studies have been done in Nigeria on the profile of brain tumours. The aim of this study is to determine the profile of brain tumours in general and determine the change in Kanofsky Performance Score (KPS) after treatment.
Methods
This is a prospective hospital-based study in Kaduna. All consecutive patients over 18 years of age with diagnosis of brain tumours from January 2016 to December 2019 were included in the study. Demographic and clinical data was collected using a proforma during the study. Patients who received treatment were followed up for 12 months. The primary outcome data was the difference in the quality of life as measured by KPS at the point of first contact and at 1-month after treatment and at 12-month follow up. Data obtained was analysed with SPSS version 25.0 for Windows. Descriptive statistics was done to determine the profile. Paired t-test at 95% confidence interval was done to check for significant correlation between the mean KPS.
Results
A total of 39 consecutive patients were included in the study. There was a slight male preponderance with a M : F of 1.17 : 1. Meningioma and metastasis were more common in females while gliomas and pituitary tumours were more common in males. The mean age of patients was 49.8 years and standard deviation of 11.8 years. Pituitary tumours were the most common tumours. The most common location of the tumour was frontal lobe followed by the pituitary gland. The mean duration of symptoms before neurosurgical consultation was 38 weeks. The most common presenting symptoms of patient with brain tumour was headache. The quality of life improve compare to the baseline in 81% of patient at discharge and at 1 year follow up. The overall mortality rate was 25.6%.
Conclusion
The most common brain tumour in our study is pituitary tumour. Most patients present late. The most common presenting symptoms is headache. There is significant improvement in the KPS of patients following treatment. The overall mortality rate at 1-year post treatment is 25.6%.
INTRODUCTION
Brain and other central nervous system (CNS) tumors are heterogeneous and can be categorized into over 100 histologic groups according to the World Health Organization’s Classification of Tumors of the CNS [17,21,22,31]. Tumours of the brain are a rare occurrence accounting for approximately 2% of all neoplasms in adults [5,24,25,34]. The incidence varies depending on the region of the globe [9,38]. In 2020, according to NIH National Cancer Institute Surveillance, Epidemiology and End Result program, it accounts for 1.3% of the total new cases and 3% of death from all cancers in the USA [28]. Clinical presentation of brain tumors depends on the location, size of the tumors, and growth rate of the neoplasm [6]. With modern diagnostic techniques such as radiological imaging, intraoperative squash cytology and histopathology, diagnosis of brain tumours is becoming more precise and accurate [27]. With increasing availability of modern imaging in Nigeria brain tumours are increasingly being diagnosed. Despite the marginal increase in the number of neurosurgeons a good number of over 170 million Nigerians have no access to neurosurgical care [23]. Where the care is available, affordability of care is a great concern. With the dwindling economy situation in the country most patients cannot afford modern imaging and available care [11]. Few studies have been done in Nigeria and other sub-Saharan countries studying the clinicopathologic and radiological features of brain tumours [13,16,29,30,37].
The aim of this study is to determine the epidemiological, clinic-radiological and pathologic features of brain tumours and to determine the outcome in patients who received care for brain tumours in a neurosurgical unit at a tertiary hospital in Northern Nigeria.
MATERIALS AND METHODS
The study was approved by the Ethics and Research Committee of Epsilon Specialist Hospital (IRB No. ESH/HREC/00212) and written informed consent was obtained from the patients or caregivers for voluntary participation in the study.
The study is a prospective study conducted at a neurosurgical unit of a tertiary hospital in the City of Kaduna in Northern Nigeria. The hospital is one of the referral centre for neurosurgical patients within the city. All consecutive patients over 18 year of age with diagnosis of brain tumour from January 2016 to December 2019 were included in the study. Diagnosis of brain tumour was made using either a computer tomographic scan or magnetic resonance imaging. Data was collected using a proforma which was administered throughout the period of care covered by the study. Information obtained included demographic, clinic-radiological and histological data. Histological findings were noted for those who had surgery. In cases where care was not possible, the reason(s) for that was noted. Patients who received treatment were followed up for 12 months. This was initially performed monthly for 3 months and thereafter 3 monthly for 9 months. Only those who had features of recurrence during follow-up had a repeat brain imaging. The primary outcome data was the difference in the quality of life as measured by Kanofsky Performance Score (KPS) at the point of first contact (baseline), at 1-month after treatment and at 12-months. Recurrence after treatment was considered a secondary outcome measure. For patient who died during the study follow-up period, the duration of death from the time of treatment was noted.
Data obtained was analysed with SPSS version 25.0 for Windows (IBM Corp, Armonk, NY, USA). Descriptive statistic was used to determine the pattern of brain tumours. Paired t-test was used to determine the relationship between KPS at baseline and at discharge and 1 year follow up for patients who received treatment at 95% confidence level.
RESULTS
A total of 39 consecutive patients were included in the study. There was a slight male preponderance with a male : female of 1.17 : 1. For the various tumour types there were variations of male : female ratio as follows; glioma, 3.5 : 1; meningioma, 1 : 2; pituitary tumour, 2.5 : 1; and metastasis, 1 : 2. The ages of the patients ranged from 28 to 68 years with a mean age of 49.8 years and standard deviation of 11.8 years. Pituitary tumours were the most common representing 35.9% followed by gliomas (23.1%), meningioma (15.4%), and secondary tumours (15.4%) (Fig. 1). Most of the pituitary tumours (71.4%) were non-functional with the remaining being prolactinomas. Two-third of the glial tumours were glioblastomas. All the operated meningiomas were benign. Four of the six metastatic brain tumours have their primaries from breast cancer while the remaining two were from prostate cancer. The most common location of the brain tumours was the frontal lobe followed by the pituitary gland.
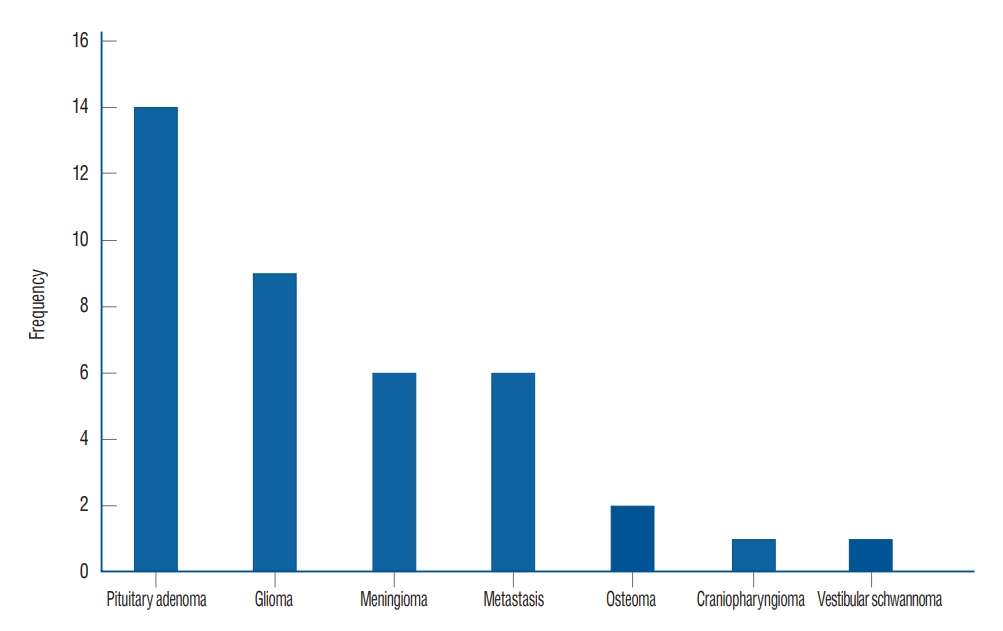
Types of brain tumours.
The mean duration of symptoms before neurosurgical consultation was 38 weeks with a range of 4 to 108 weeks. Patient with gliomas presented earlier with a mean time of presentation of 5.25 weeks while those with meningioma presented very late with a mean of 69.67 weeks (Table 1).
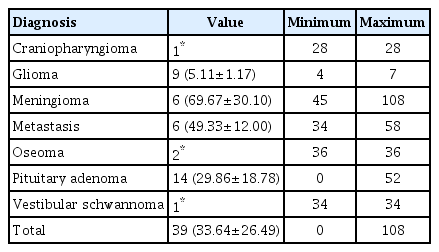
Mean duration of symptoms before neurosurgical consultation in weeks
The most common presenting symptom of patients with brain tumours was headache followed by gait anomalies and limb weakness. Other clinical features are shown on Fig. 2.
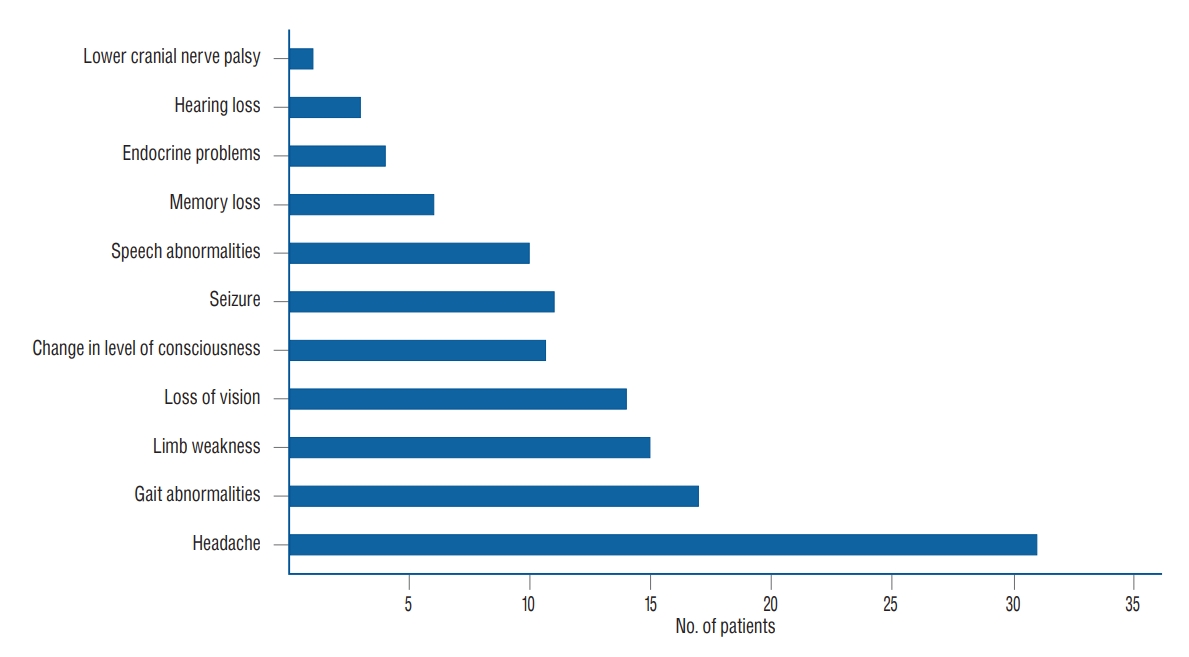
Clinical features of brain tumors.
Most of our patients (86.6%) received treatment for their brain tumours. Treatment available include craniotomy for hemispheric lesion in 43.6% and endoscopic endonasal transsphenoidal removal for pituitary tumours. In 15.4% of patients only biopsy and steroid therapy was done. Five patients who had prolactinoma were treated with bromocriptine and/or cabergoline. In one patient with cerebellopontine angle tumour only ventriculoperitoneal shunt was inserted before the patient was lost to follow-up (Fig. 3). Patients with metastatic tumours received additional chemotherapy depending on the primary source of tumour. The two patients with prostate cancer had bilateral subcapsular orchidectomy as treatment for their primary tumours. Six patients declined treatment for financial and religious reasons.
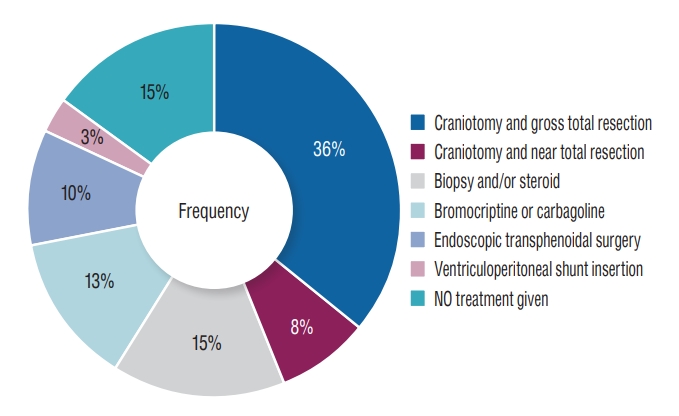
Treatment of brain tumours.
The mean KPS of patients improved after discharge from 55.3% at baseline to 83.75% at discharge, however at 1 year follow up it has decreased to 68.44%. Patients with benign lesion and those who had gross total resection of their tumours have better improvement in their KPS. Malignant tumours contributed to the dropped in the mean total KPS at 1 year (Table 2).

Mean KPS for patients based on diagnosis of brain tumour at baseline, discharge and 1-year follow-up
The differences between the mean of baseline KPS and at discharge were statistically significant at 95% confidence interval (p<0.05). Similarly, the differences between the mean KPS at baseline and at 1-year follow-up were statistically significant at 95% confidence interval (p<0.05). However, there is no statistically significance difference between the mean KPS at discharge and at 1-year of follow up (Table 3).
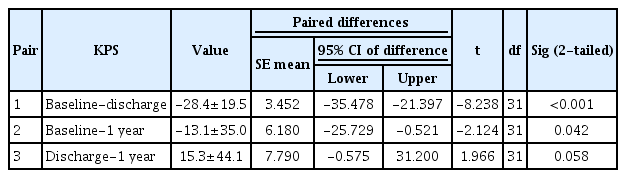
Paired t-test comparing the means KPS at baseline, discharge and 1-year follow-up
There was one mortality in a patient with long standing meningioma which occurred on the 7th post-operative day. During follow-up two patients with glioblastoma had recurrence. None of the patients with glioblastoma had radiation therapy due to non-availability of the treatment modality in our centre. By 6-month of follow up only two of the patients who had glioblastoma and metastasis were alive. The mean duration from surgery to death was 116 days ranging from 7 to 197 days. At 1 year follow up most patients who were alive had good quality of life. The overall mortality rate was 25.6%.
DISCUSSION
Brain tumour is increasingly being diagnosed in Nigeria. In this study there is a slight male preponderance. This finding is similar to other studies [4,10,24,27,36,39]. On the contrary some studies within Nigeria reported a female predominance or equal proportion in both genders [1,16,33]. However, among the common tumour types meningioma and metastasis occurred more in female while the gliomas and pituitary tumours have male predominance. This is similar to findings in most studies [14,15,19,27]. Leece et al. [20] has established that meningioma is more common in females due to hormonal exposure (estrogen) at menarche, parity, menopause and hormone replacement therapy.
The mean age of adults with brain tumour in the study was 49.8. This finding is similar to reports in some study [7,27]. It is however slightly higher than study done at the national hospital in Abuja [16]. The study in Maiduguri reported lower mean age group because paediatric patients were included in the study and brain tumours are known to have bimodal age presentations [33].
The vast majority of tumours other than pituitary tumours occurred in the frontal lobe. This finding is similar to results reported in Maiduguri, Nigeria and by Mondal et al. [27] in India and Soyemi and Oyewole [33]. In a study conducted in Enugu Nigeria, metastatic brain tumours were found to be more common in the frontal lobe [3].
The most common tumour type in this study was pituitary adenoma, followed by gliomas. Meningioma and secondary tumour came third in equal proportion. Tuly [36] reported the pituitary gland as the most common site for tumours. In contrast to our findings, a study in Maiduguri, Nigeria showed that intraaxial tumours such as gliomas are more common [33]. In Abuja Nigeria, a study found that meningiomas were the most common followed by pituitary adenomas and gliomas, similar to reports from India, Egypt, Ghana, England, and USA [2,8,12,16,26,35].
The most common presenting symptoms was headache, other presentations include gait anomalies, limb paresis, deterioration of vision, change in sensorium, seizure and speech anomalies. Previous studies reported headache as the most common symptoms [3,24,27].
The mean duration of symptoms before neurosurgical consultation was 38 weeks with a range of 4 to 108 weeks. This finding was similar to findings elsewhere [32]. Patients with glioblastoma and metastasis presented much earlier than those with benign tumours. The delayed presentation in this study may be due to the fact that most patients would have been treated for typhoid and malaria when they complain of headaches. Most of the time because of limited availability of neuroimaging and the cost when available most general practitioners are reluctant to send patients for neuroimaging. Sometimes when patients are referred, they are unable to afford care immediately.
Most of our patient received treatment for their tumours while some rejected treatment because of financial constraints, religion and sociocultural reasons. Most had craniotomy and with either gross total or near total resection of the tumours. In some, only biopsy and steroid therapy was possible. This is because the tumours were deeply seated and not easily accessible due to limitation of facilities. Those with pituitary tumours had endoscopic endonasal transsphenoidal surgery. This treatment modality is gradually becoming increasingly available in Nigeria [18].
At discharge most of our patients who received treatment experienced significant improvement in their KPS. The drop in the mean total KPS at one year follow up is due to the mortality among patients with malignant forms of brain tumours (glioblastomas and metastasis) [6]. These two conditions are known to have poor prognosis. In study, adjuvant radiotherapy was not possible because all patients referred for it were unable to afford it. Most patients with benign brain tumours in our study experienced increased in their KPS at discharge and at one year follow-up.
The in-hospital mortality during the initial treatment in this series was 2.6%, however at 1 year of follow up the mortality increased to 25.6%. The mortality occurred in patients with grade 4 gliomas and secondary brain tumours. The high mortality in patients in these patients is not unrelated to late presentation and lack of facilities for external beam radiation in our institution.
Limitations of the study
This is a hospital-based study and thus may not reflect the pattern of brain tumours in the population. This study was conducted at single hospital. This study is heterogenous combining different types of tumour.
Recommendations
A national brain tumour registry should be established to get a national pattern of the tumours. A multicenter study should be done in the country. This will provide larger sample for better understanding of the true pattern and outcome of brain tumours in Nigeria.
CONCLUSION
The most common brain tumour in our study was pituitary tumour followed by glioma, meningioma and secondary tumours. Most patients presented late. The most common presenting symptoms was headache. There was significant improvement in the quality of life of patients following treatment. The overall mortality rate at 1-year post treatment was 25.6%.
Notes
Conflicts of interest
No potential conflict of interest relevant to this article was reported.
Informed consent
Informed consent was obtained from all individual participants included in this study.
Author contributions
Conceptualization : SD, HAD, INJ; Data curation : SD, HAD, AIK, KSA; Formal analysis : SD; Methodology : SD, HAD, AIK, KSA, INJ; Visualization : SD, HAD, AIK, KSA, INJ; Writing - original draft : SD; Writing - review & editing : SD, HAD, AIK, KSA, INJ
Data sharing
None
Preprint
None